Emerging Markets Monetary and Fiscal Policy
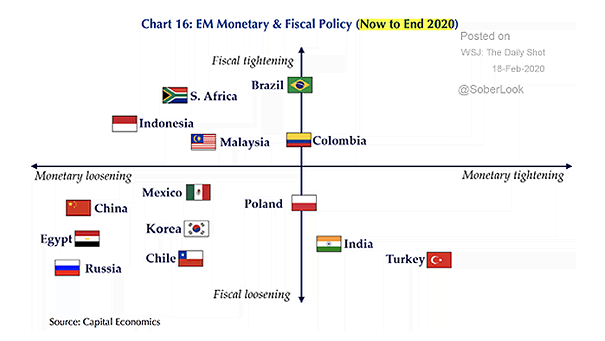
Emerging Markets Monetary and Fiscal Policy This chart puts monetary and fiscal policy in emerging markets into perspective (now to end 2020). Image: Capital Economics
Emerging Markets Monetary and Fiscal Policy This chart puts monetary and fiscal policy in emerging markets into perspective (now to end 2020). Image: Capital Economics
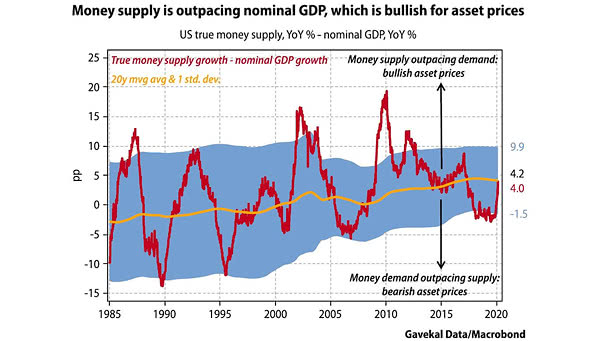
U.S. True Money Supply and Nominal GDP Growth This chart suggests that money supply outpacing U.S. nominal GDP tends to be bullish for asset prices. Image: Gavekal, Macrobond
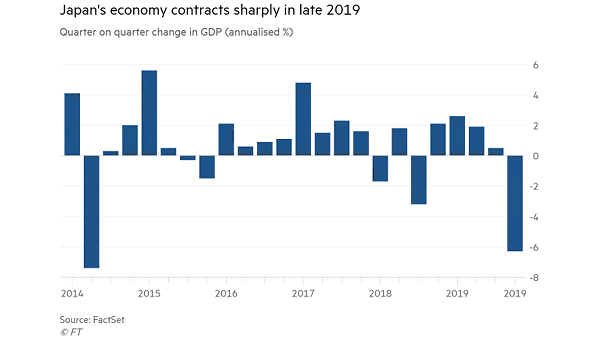
Japan GDP Japan’s economy shrunk at a 6.3% annual rate in late 2019 after sales-tax hike. Image: Financial Times
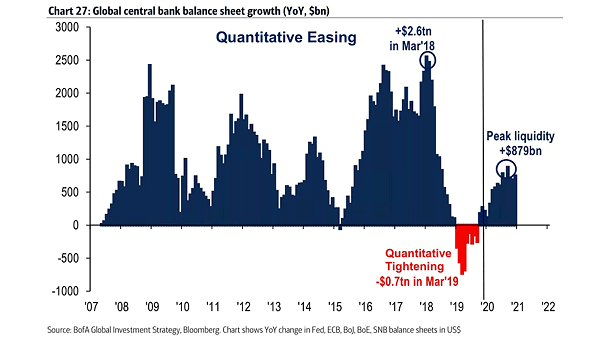
Global Central Bank Balance Sheet Growth and Quantitative Easing BofA suggests that global central bank balance sheets will peak at $879bn in September 2020. Image: BofA Global Investment Strategy
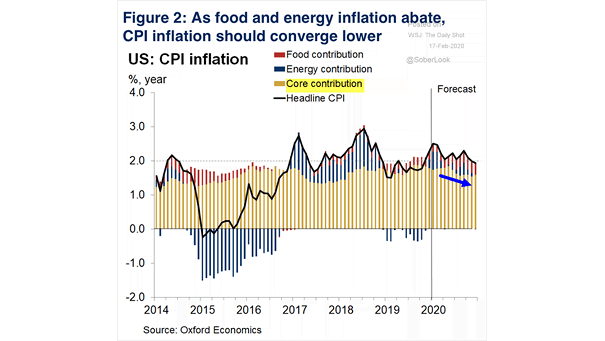
U.S. CPI Inflation Chart suggesting lower inflation ahead. Image: Oxford Economics
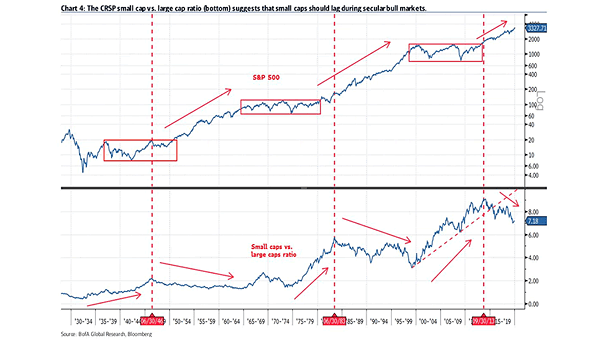
Secular Bull Market – S&P 500 and Small Caps vs. Large Caps Ratio This chart suggests that secular bull markets are bearish for small caps. Image: BofA Global Research
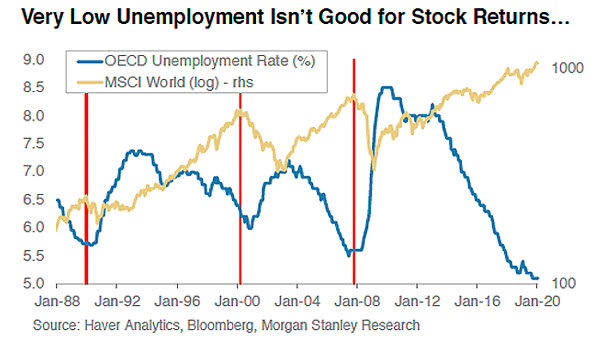
OECD Unemployment Rate and MSCI World As the chart suggests, very low unemployment isn’t usually great for stocks returns. Image: Morgan Stanley Research
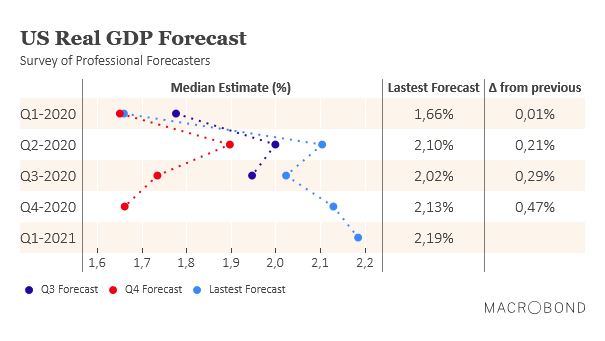
U.S. Real GDP Forecast According to 37 professional forecasters surveyed by the Federal Reserve Bank of Philadelphia, U.S. real GDP is expected to grow 2% in 2020 and should continue to improve next year. Image:…
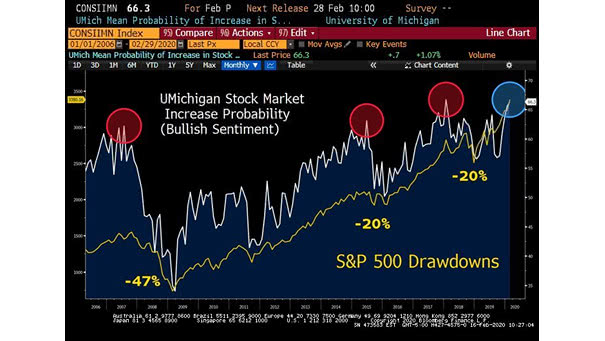
University of Michigan Stock Market Increase Probability Next Year and S&P 500 Drawdowns This chart suggests to remain vigilant on the U.S. stock market, when bullish sentiment is so high. Image: Bloomberg
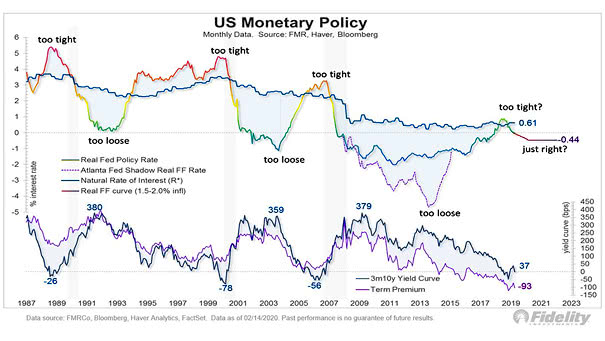
U.S. Monetary Policy, Term Premium and Yield Curve This chart suggests when U.S. monetary policy is too tight or too loose. An inverted yield curve is a sign that monetary policy is too tight. Image:…
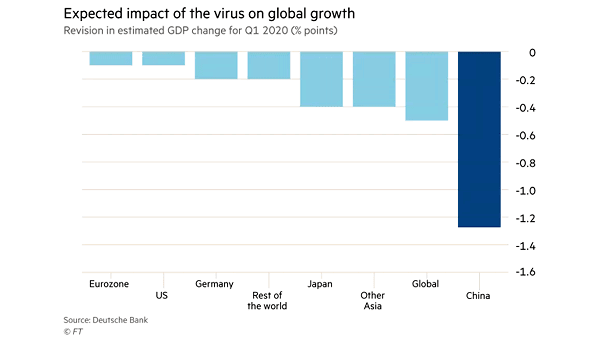
Expected Impact of Coronavirus on Global GDP Growth Chart suggesting that in the first quarter of 2020, the Chinese economy will experience its slowest growth since the global financial crisis. Image: Financial Times