Wage Growth and U.S. Productivity (Leading Indicator)
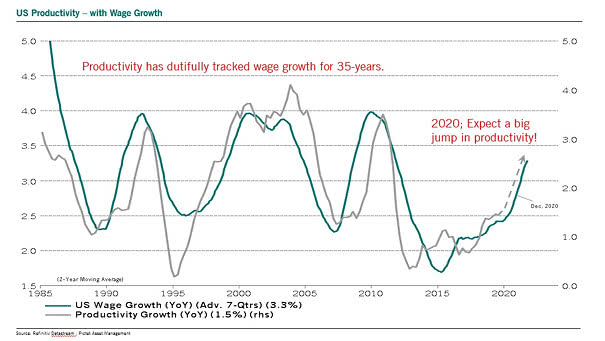
Wage Growth and U.S. Productivity (Leading Indicator) This chart suggests that wage growth tends to lead U.S. productivity by 21 months. Image: Pictet Asset Management
Wage Growth and U.S. Productivity (Leading Indicator) This chart suggests that wage growth tends to lead U.S. productivity by 21 months. Image: Pictet Asset Management
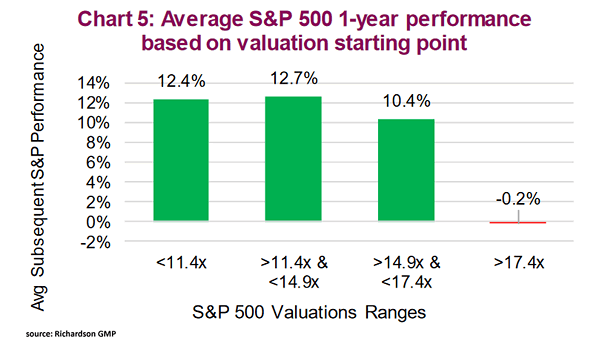
Average S&P 500 1-Year Performance Based on Valuation Starting Point The S&P 500 P/E ratio is over 18x currently. As valuations rise, expected returns fall. Image: Richardson Wealth
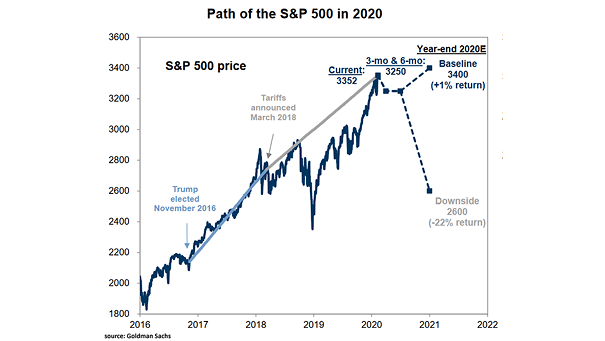
Forecast: Path of the S&P 500 in 2020 Goldman Sachs sees limited upside for the S&P 500 from current levels and set a price target of 3400 by the end of 2020. Image: Goldman Sachs
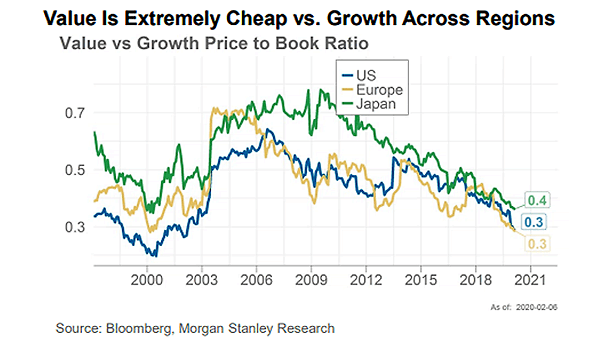
Global Equities: Value vs. Growth Price to Book Ratio Chart suggesting that value is extremely cheap vs. growth across regions, but the trend is still intact for the time being. Image: Morgan Stanley Research
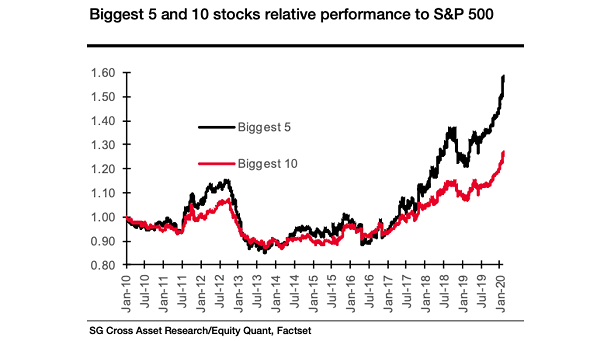
Biggest 5 and 10 Stocks Relative Performance to S&P 500 The biggest 5 and 10 stocks have significantly outperformed the S&P 500 over the past three years. Image: Societe Generale Cross Asset Research
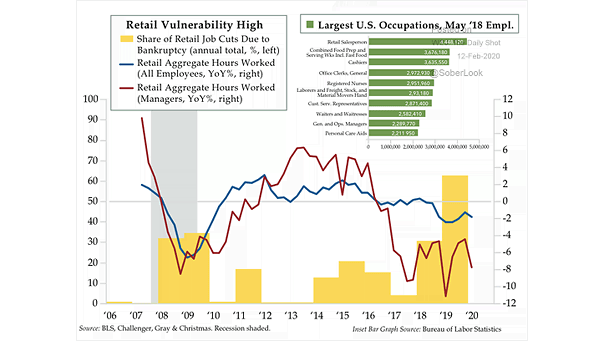
U.S. Retail Vulnerability High Retail job cuts due to bankruptcies are way up and hit highest level since 2005. Image: Quill Intelligence, LLC
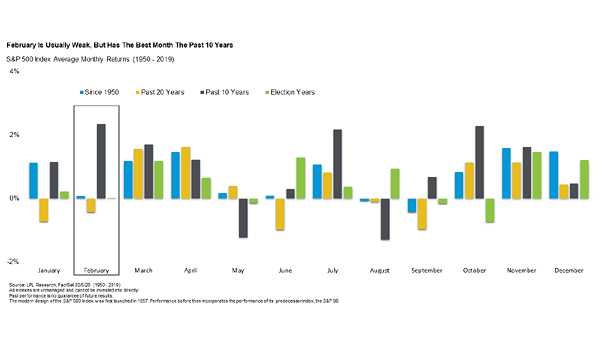
S&P 500 Index Average Monthly Returns Since 1950 and Elections Years February has averaged zero during an US election year since 1950, but has the best month the past 10 years. Image: LPL Research
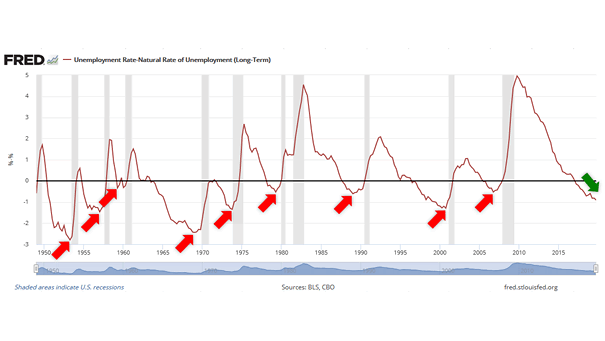
U.S. Unemployment Rate Minus U.S. Natural Rate of Unemployment and Recessions The unemployment rate minus the natural rate of unemployment has been negative for 34 months, and tends to bottom before a recession.
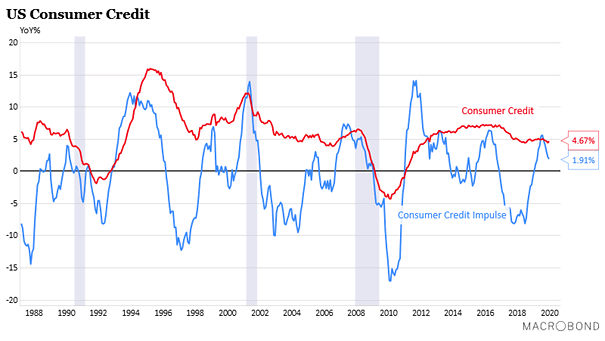
U.S. Consumer Credit The current downtrend in US consumer credit impulse could suggest a scenario of slowing growth this year. Image: Macrobond Financial
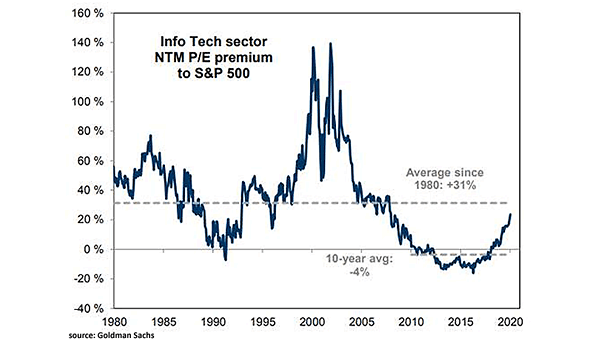
Info Tech Sector NTM P/E Premium to S&P 500 Is the tech sector expensive relative to the S&P 500? Image: Goldman Sachs Global Investment Research
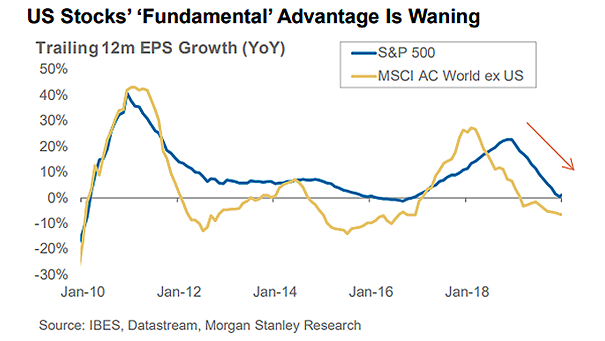
Trailing 12 Month EPS Growth: S&P 500 vs. MSCI AC World ex U.S. Chart suggesting that the “fundamental” advantage of U.S. stocks is diminishing. Image: Morgan Stanley Research