Weekly Net Flows into Bond Mutual Funds and ETFs
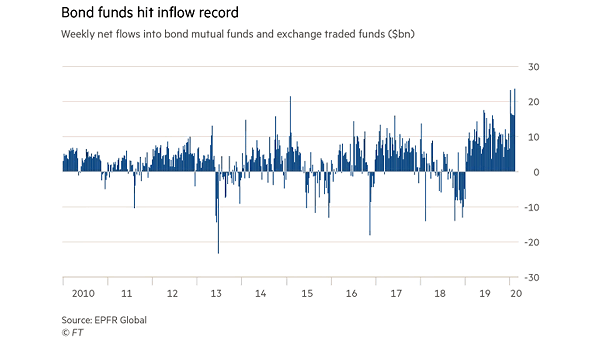
Weekly Net Flows into Bond Mutual Funds and ETFs Bond funds benefit from record inflows, reflecting investor fears about the coronavirus’s spread. Image: Financial Times
Weekly Net Flows into Bond Mutual Funds and ETFs Bond funds benefit from record inflows, reflecting investor fears about the coronavirus’s spread. Image: Financial Times
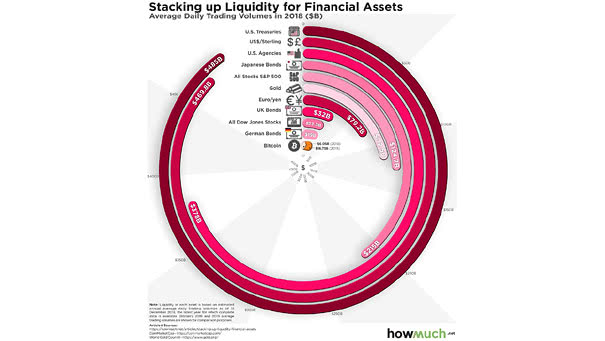
Liquidity – Average Daily Trading Volumes U.S. treasuries are the most liquid class of assets, with an average of $485 billion a day in 2018. Image: howmuch.net
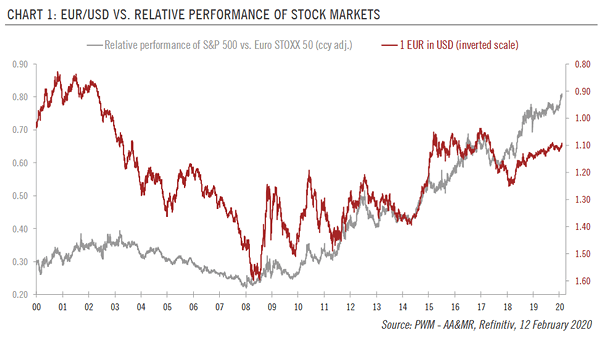
Relative Performance of S&P 500 vs. Euro Stoxx 50 and EUR/USD EUR/USD fell to lowest level since May 2017. The growth differential should remain in favor of the US dollar. Image: Pictet Wealth Management
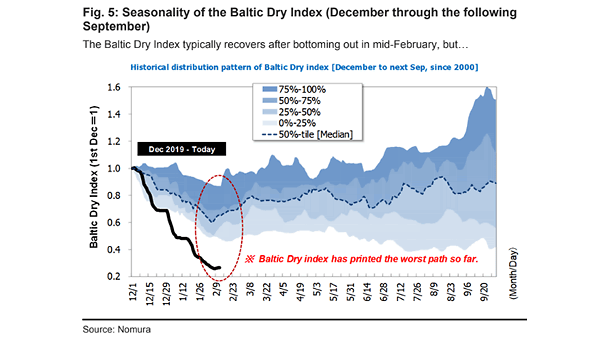
Seasonality of the Baltic Dry Index The Baltic Dry Index has declined as a result of seasonality and the coronavirus. Image: Nomura
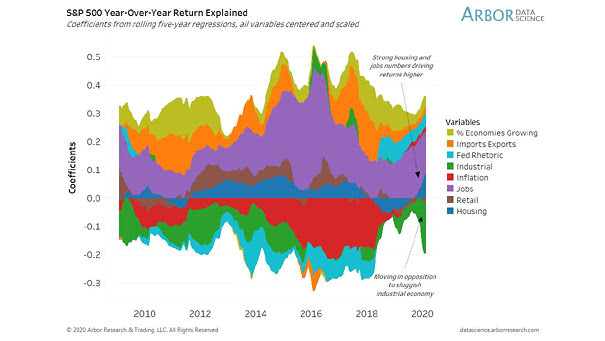
S&P 500 Year-Over-Year Return Explained Chart suggesting that strong housing and jobs growth explain S&P 500 returns. Image: Arbor Research & Trading LLC
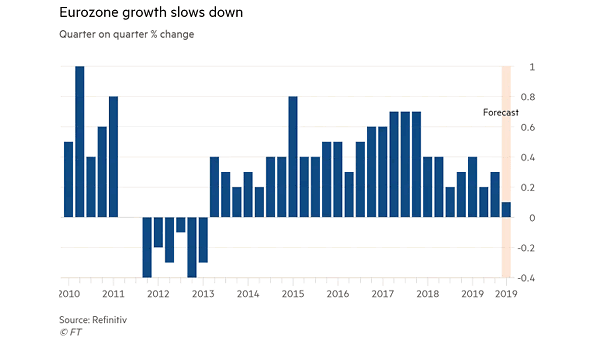
Eurozone Growth Eurozone growth slows sharply, almost to zero. Image: Financial Times
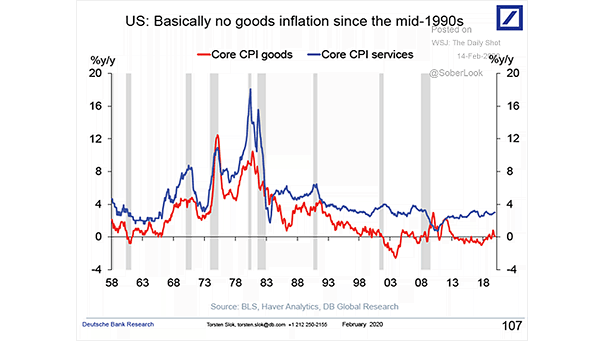
Inflation – U.S. Core CPI Goods and Core CPI Services 20 years of almost no inflation in goods. Image: Deutsche Bank Global Research
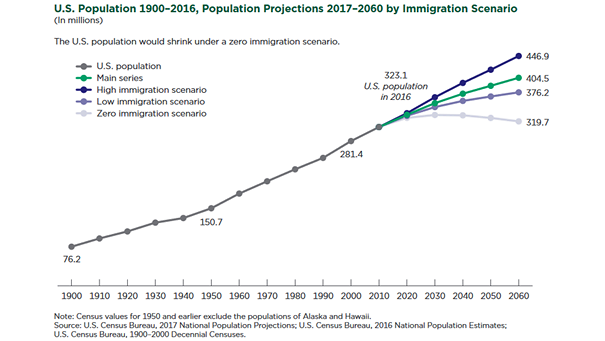
Demographics – U.S. Population Projections Under Alternative Immigration Scenarios In a high immigration scenario, the U.S. population is projected to grow to 446.9 million in 2060. Image: U.S. Census Bureau
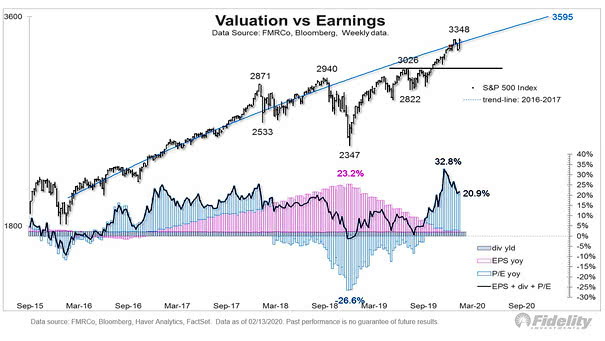
Earnings, Dividends and Valuation Chart showing the deviation of the S&P 500 Index against its trend line. The U.S. stock market needs earnings growth to rise this year. Image: Fidelity Investments
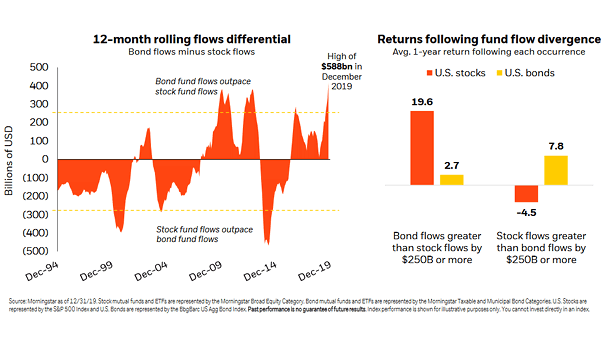
U.S. Stocks and U.S. Bonds: Returns Following Fund Flow Divergence In 2019, bond fund flows outpaced stock fund flows. The difference is the largest ever recorded ($588bn). Image: BlackRock Investment Institute
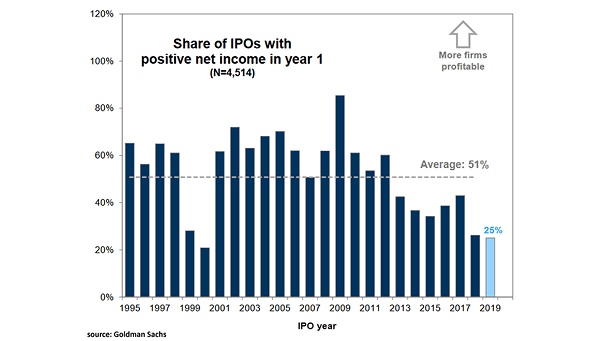
Share of IPOs with Positive Net Income in Year 1 The IPO class of 2019 is the least profitable of any year since the internet bubble. Image: Goldman Sachs Global Investment Research