Global Growth, Equity Rally and Fed Balance Sheet
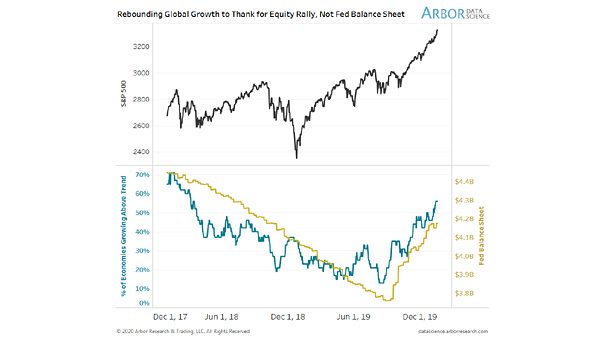
Global Growth, Equity Rally and Fed Balance Sheet This chart suggests that economic data is the driving force behind the equity rally, not the Fed’s balance sheet. Image: Arbor Research & Trading LLC
Global Growth, Equity Rally and Fed Balance Sheet This chart suggests that economic data is the driving force behind the equity rally, not the Fed’s balance sheet. Image: Arbor Research & Trading LLC
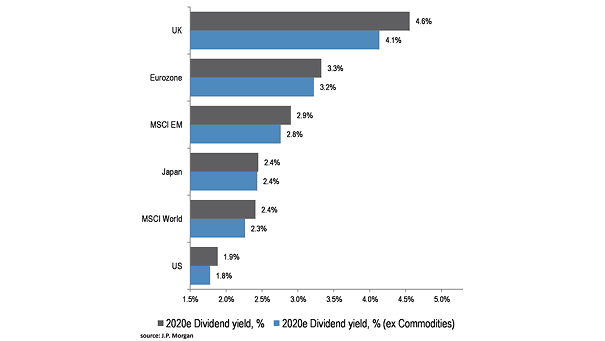
2020E Dividend Yield This chart puts 2020E dividend yields into perspective. Image: J.P. Morgan
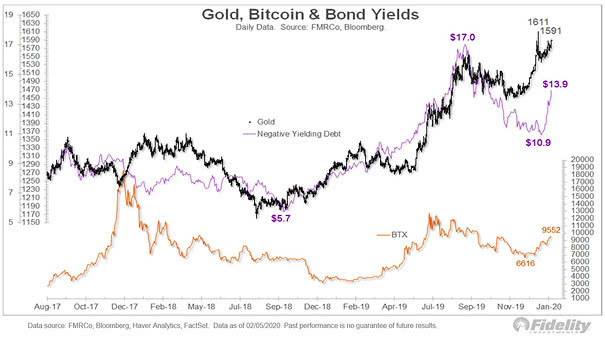
Gold, Bitcoin and Negative Yielding Debt Chart suggesting that gold price and bitcoin have been boosted by rising negative-yielding debt. Image: Fidelity Investments
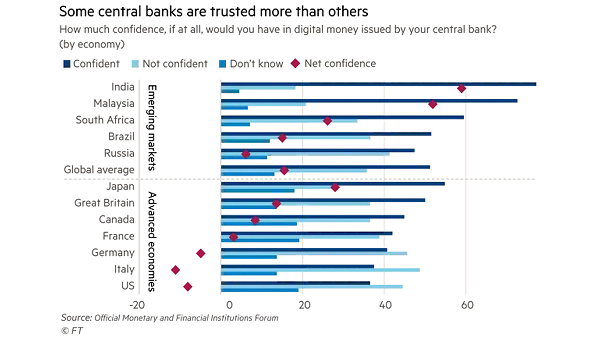
Confidence in Central Banks and Cryptocurrency This chart suggests substantial loss in confidence in some central banks. Image: Financial Times
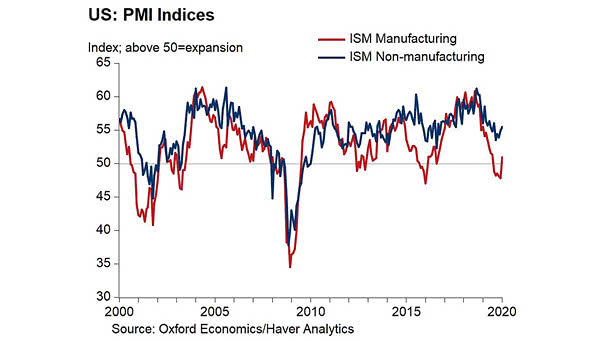
ISM Manufacturing Index vs. ISM Non-Manufacturing Index The ISM Non-Manufacturing Index increased to 55.5% in January and suggests faster expansion in January than in December. Image: Oxford Economics
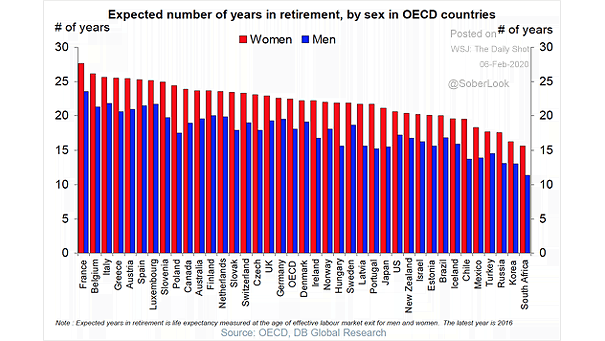
Expected Number of Years in Retirement in OECD Countries Currently, France has the highest expected time in retirement. Image: Deutsche Bank Global Research
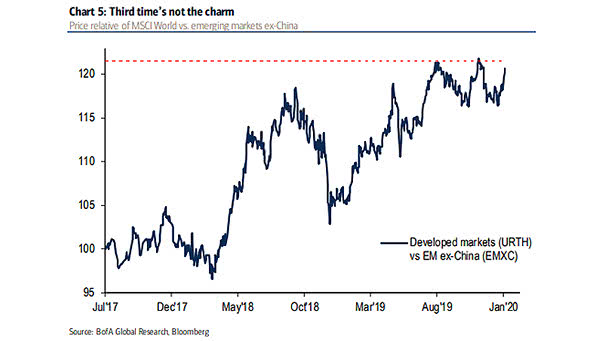
Price Relative of MSCI World vs. Emerging Markets ex-China Emerging markets ex-China benefit from modernization potential, favorable demographics, and attractive valuations for the long term, according to BofA. Image: BofA Global Research
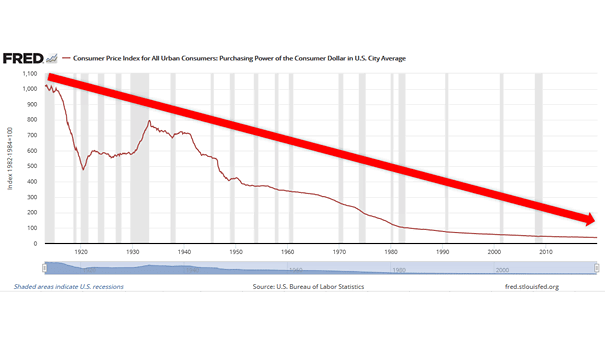
Purchasing Power of the Consumer Dollar in U.S. City Average As prices increase, the purchasing power of the consumer’s dollar declines. US$100 in 1913 would only be worth US$3.87 today.
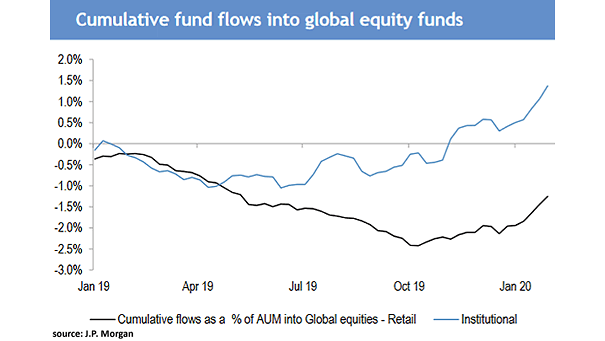
Cumulative Fund Flows into Global Equity Funds Institutional investors are back buying stocks. Image: J.P. Morgan
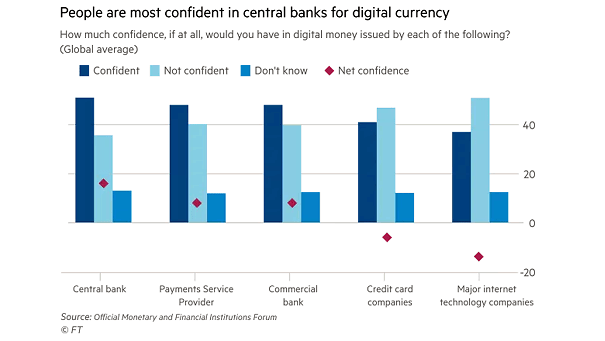
Digital Money and Confidence A majority of people across the world don’t trust big tech companies to issue digital money. Image: Financial Times
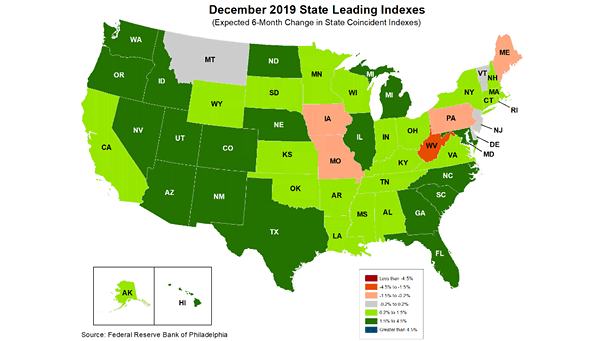
Philly Fed Leading Index and Recession The Philly Fed Leading Index for the United States suggests that the U.S. economy is still in expansion mode over the next 6 months. Image: Federal Reserve Bank of…