SARS Outbreak and Global Bonds
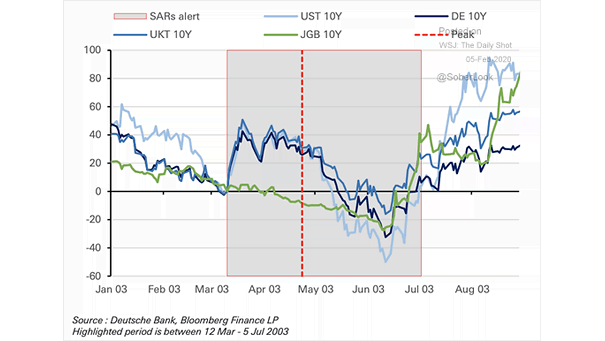
SARS Outbreak and Global Bonds This chart shows that the impact of the SARS outbreak on global bonds was short-lived. Image: Deutsche Bank
SARS Outbreak and Global Bonds This chart shows that the impact of the SARS outbreak on global bonds was short-lived. Image: Deutsche Bank
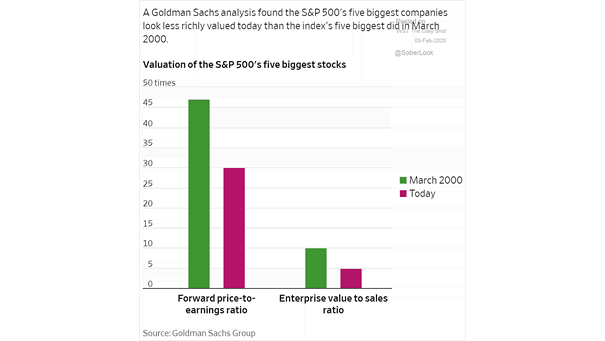
Valuation of the S&P 500’s Five Biggest Stocks This chart compares the valuation of the S&P 500’s five biggest stocks between now and March 2000. Image: The Wall Street Journal
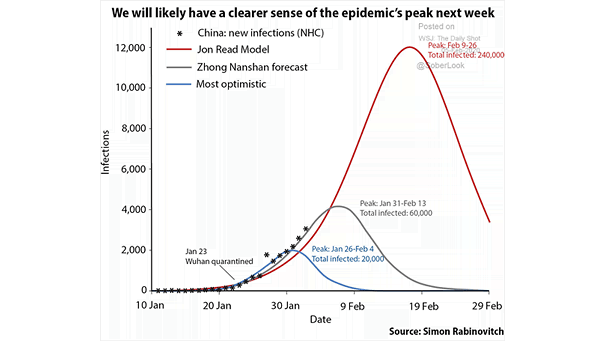
Coronavirus and Potential Scenarios Will the coronavirus outbreak soon reach its peak? Image: Gavekal
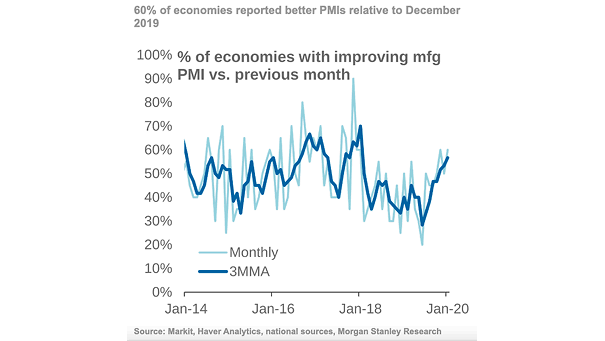
% of Economies with Improving Manufacturing PMI vs. Previous Month Global manufacturing outlook improves, as 60% of economies reported better PMIs relative to December 2019. Image: Morgan Stanley Research
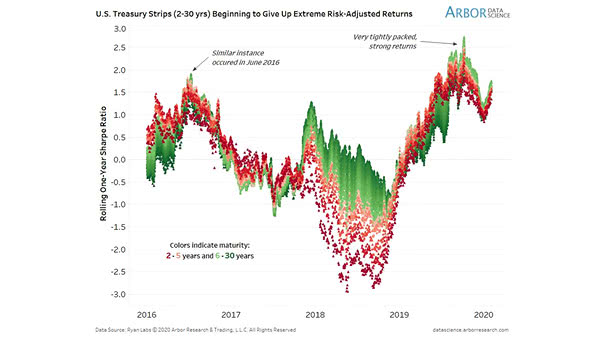
Sharpe Ratio and U.S. Treasury Strips Curve Historically, high sharpe ratios have been usually unsustainable. Image: Arbor Research & Trading LLC
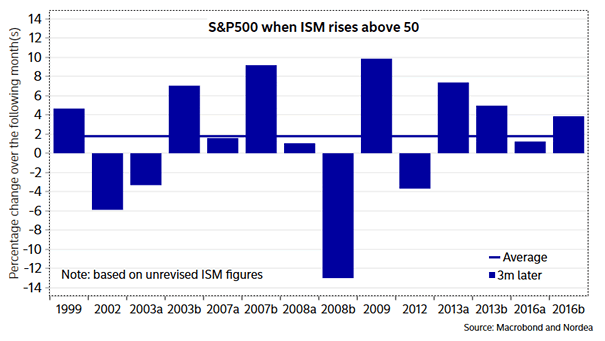
S&P 500 and ISM Manufacturing Index In recent history, when the ISM Manufacturing Index rose above 50, the S&P500 rose by about 2% on average over the next 3 months Image: Nordea and Macrobond
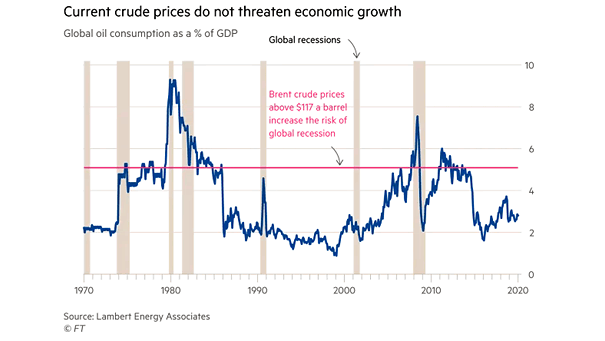
Global Oil Consumption as a % of GDP and Global Recessions Chart suggesting that Brent crude prices need to exceed US$117 to push the global economy into recession. Image: Financial Times
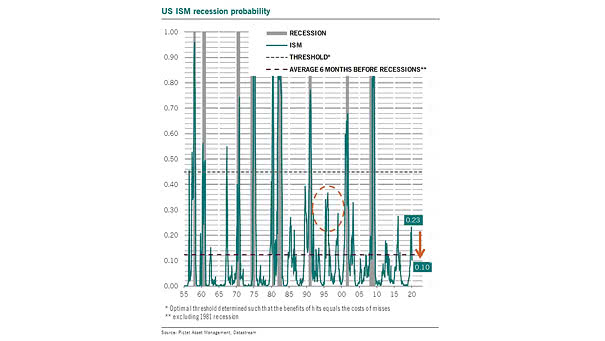
U.S. ISM Recession Probability Chart showing that historically, a level greater than 44.5% has indicated a recession. Current U.S. ISM levels suggest a recession probability of 10%. Image: Pictet Asset Management
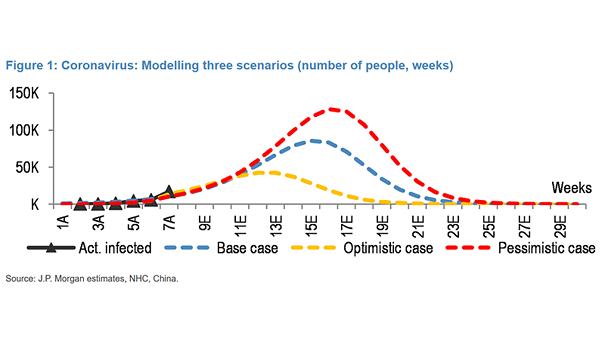
Coronavirus and Three Forecasts Optimistic case: peak of ~42k infections by the 2nd week of March Base case: peak of ~85k infections at the end of March Pessimistic case: peak of ~128k infections by the…
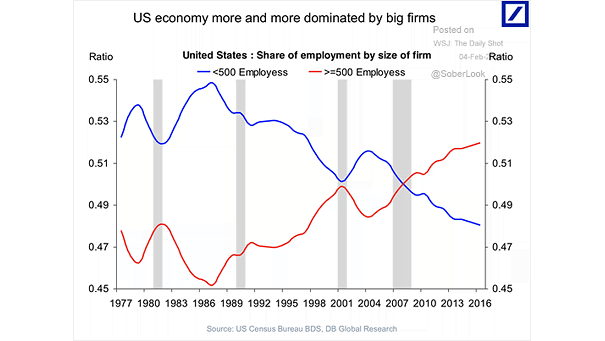
U.S. Big Companies and U.S. Job Market Big firms dominate the U.S. economy and the U.S. job market. Image: Deutsche Bank Global Research
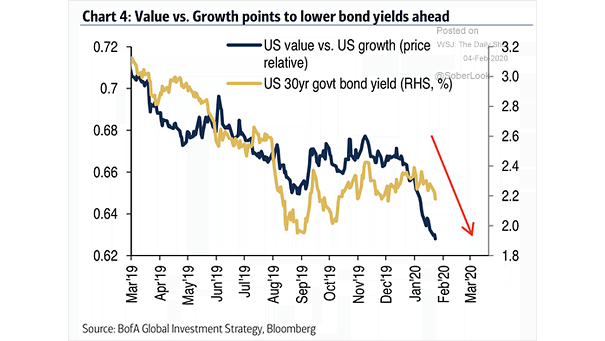
Value vs. Growth and U.S. 30-Year Government Bond Yield The outperformance of U.S. growth stocks relative to U.S. value stocks suggests lower bond yields ahead. Image: BofA Global Investment Strategy