Volatility – Gamma Transition Level and VIX
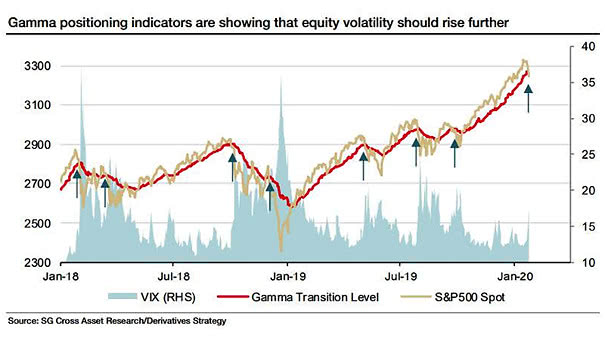
Volatility – Gamma Transition Level and VIX Gamma positioning indicators suggest more volatility ahead. Image: Societe Generale Cross Asset Research
Volatility – Gamma Transition Level and VIX Gamma positioning indicators suggest more volatility ahead. Image: Societe Generale Cross Asset Research
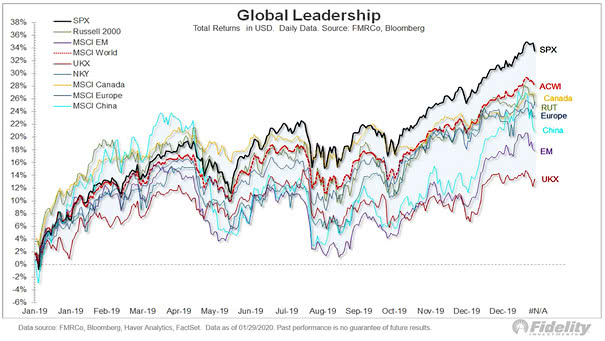
Global Stock Markets Total Returns in 2019 Chart showing how major global stock markets performed in 2019. Image: Fidelity Investments
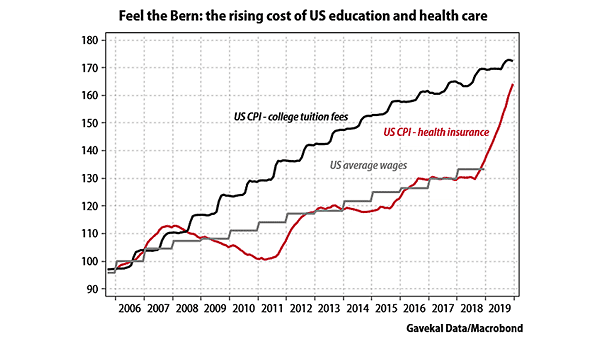
Inflation – The Rising Cost of U.S. Education and Health Care The costs of health care and education have risen faster than other goods. Image: Gavekal, Macrobond
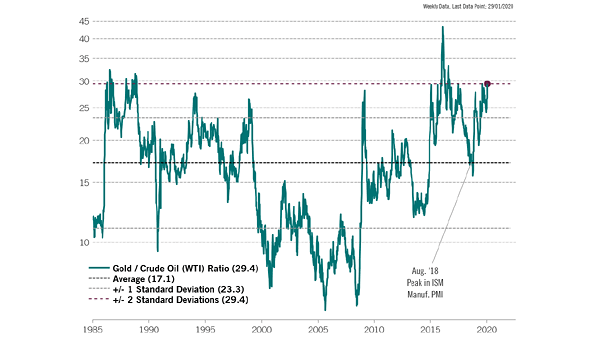
Gold to Oil Ratio Chart suggesting that the gold to oil ratio (at two standard deviations of the mean), is not expected to remain at these levels for long. Image: Pictet Asset Management
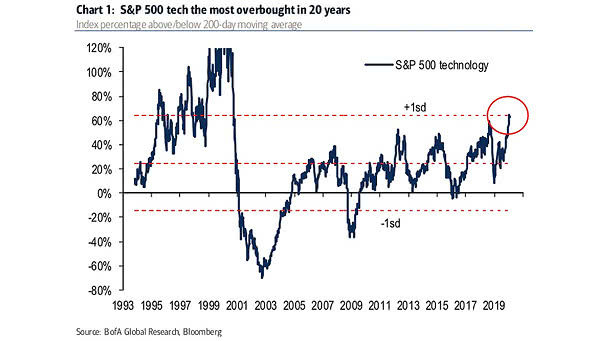
S&P 500 Technology – Percentage Above/Below 200-Day Moving Average Chart suggesting that the S&P 500’s tech sector is the most overbought since the internet bubble. Image: BofA Global Research
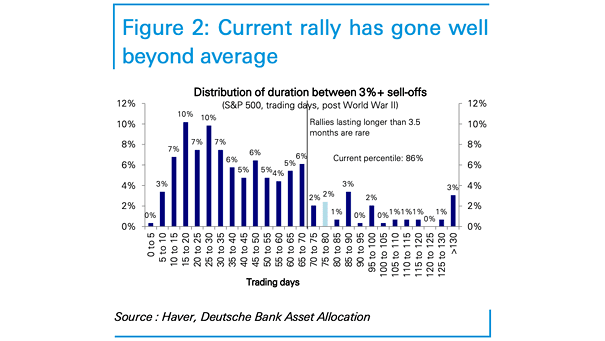
S&P 500 Rallies – Distribution of Duration Between 3%+ Sell-Offs Rallies lasting more than 100 days are rare. Image: Deutsche Bank Asset Allocation
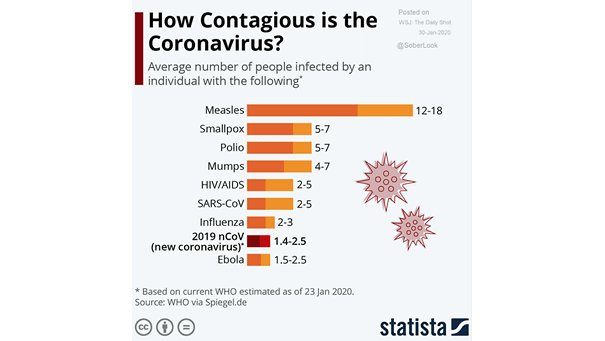
How Contagious is the Coronavirus? This chart shows how contagious the coronavirus is, while coronavirus cases have increased dramatically over the past week. Image: Statista
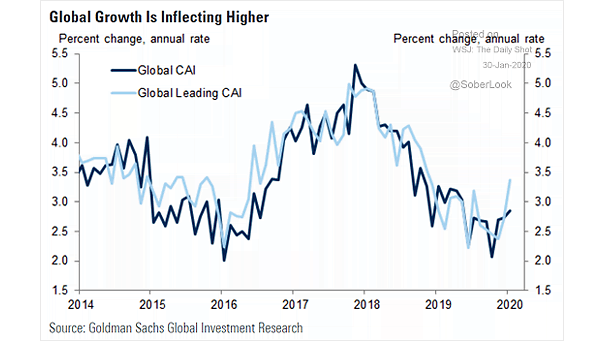
Global Growth – Global Current Activity Indicator (CAI) Chart suggesting that global growth is on the up. But will the coronavirus outbreak curb it? Image: Goldman Sachs Global Investment Research
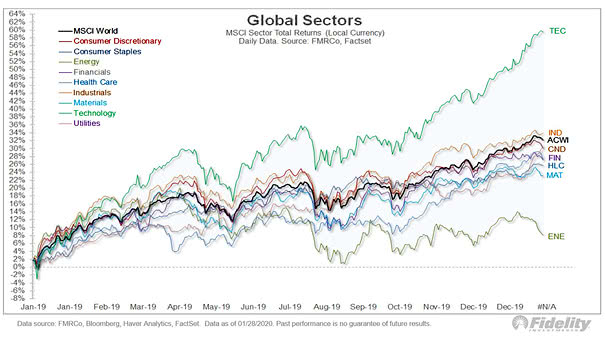
MSCI Sector Total Returns in 2019 Chart showing how global sectors performed last year. Image: Fidelity Investments
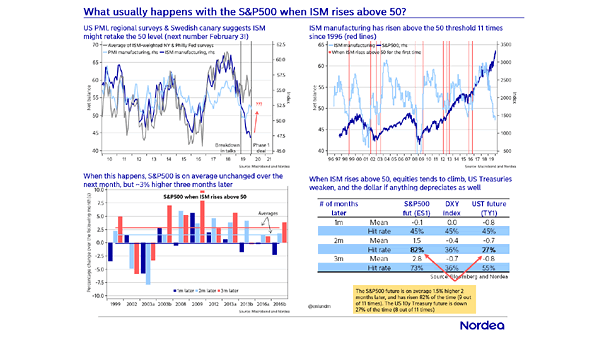
S&P 500 When ISM Manufacturing Index Rises Above 50 When the ISM Manufacturing Index rises above 50, U.S. Treasuries and the U.S. dollar tend to weaken, while the S&P 500 tends to rise. Image: Nordea…
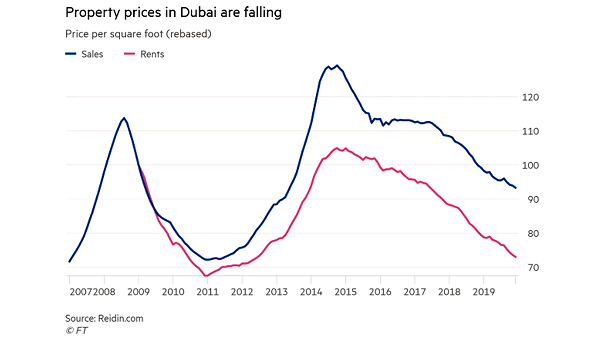
Housing – Property Prices In Dubai Are Falling In 2019, residential and commercial prices in Dubai fell 13% to 15%. Image: Financial Times