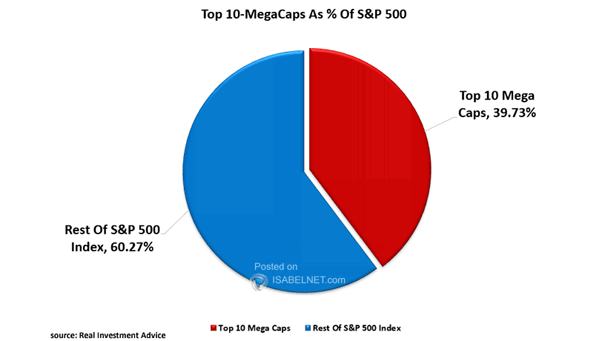
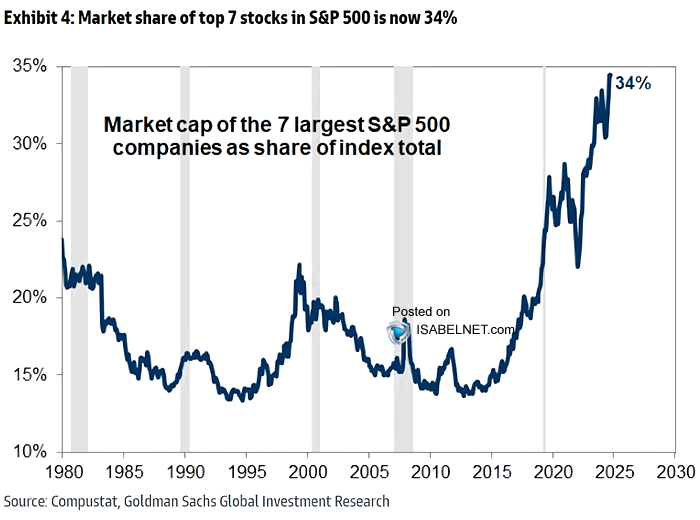
ISABELNET Cartoon of the Day
ISABELNET Cartoon of the Day After the S&P 500’s 2.92% rise last week, bulls are ready to party, but bears insist it’s too soon to celebrate-a bear market rally might crash the party! Have a…
Median S&P 500 Performance During 10% Corrections If there is no recession, U.S. stocks tend to do well after market corrections, often rebounding strongly and offering attractive returns to investors who stay the course. Image:…
Aggregate U.S. Dollar Position, Non-Commercial Traders Speculators are holding their most bearish positions on the U.S. dollar since September 2024, driven by global optimism, de-dollarization trends, and relative strength in other major currencies. Image: Bloomberg
S&P 500 8-Day Rolling % Returns Rolling 8-day returns for the S&P 500, combined with technical and sentiment indicators, suggest the index is likely to enter a period of consolidation in the near term. Image:…
ISABELNET Cartoon of the Day With the S&P 500 up 2.92% this week, bulls are confident the market’s momentum will continue, while bears argue it’s just a bear market rally! Have a Great Weekend, Everyone!…
Trade Policy Uncertainty When trade policy uncertainty peaks, the S&P 500 often posts positive returns. Markets tend to over-discount risks during uncertain periods, and relief rallies are common once worst-case scenarios are avoided or resolved.…
S&P 500 Index Return During May The “sell in May and go away” adage is more myth than practical advice. Rather than trying to time the market, focusing on long-term goals is wiser-especially since May…
Price of Gold While gold remains in a long-term bull market, short-term pullbacks are normal following strong advances-especially as factors driving safe-haven demand begin to fade. Image: The Daily Shot
ISABELNET Cartoon of the Day Despite a strong rally this week, the S&P 500 index ended April down 0.76%. No need to panic-this isn’t a call to “Make Bears Great Again!” unless you prefer market…
Probability of U.S. Recession As Priced Across Asset Classes The S&P 500 is pricing in about a 25% chance of a recession, which is lower than signals from copper prices or the yield curve, but…
S&P 500 Index vs. 200 and 40-Week Moving Averages Despite recent volatility driven by trade concerns, as long as the S&P 500 index is trading above the 200-week moving average, the secular bull market remains…