OECD Total LEI lead OECD Real GDP
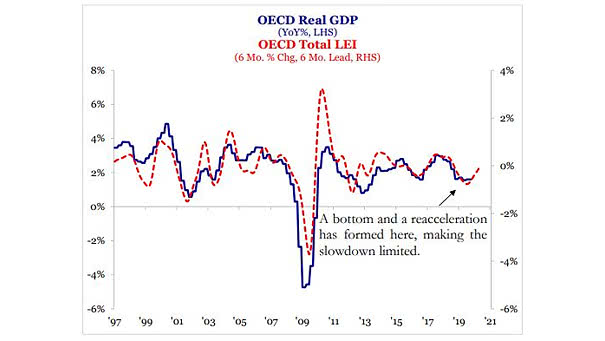
OECD Total LEI lead OECD Real GDP This chart suggests that the OECD’s leading economic indicators lead OCDE real GDP by 6 months. Image: Strategas
OECD Total LEI lead OECD Real GDP This chart suggests that the OECD’s leading economic indicators lead OCDE real GDP by 6 months. Image: Strategas
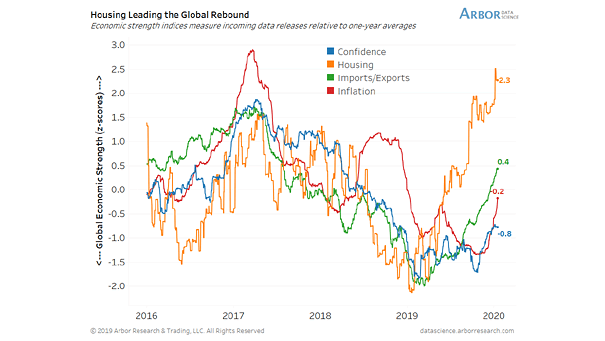
Housing, Confidence, Imports-Exports and Inflation Chart suggesting that housing data is improving and is a leading indicator. Image: Arbor Research & Trading LLC
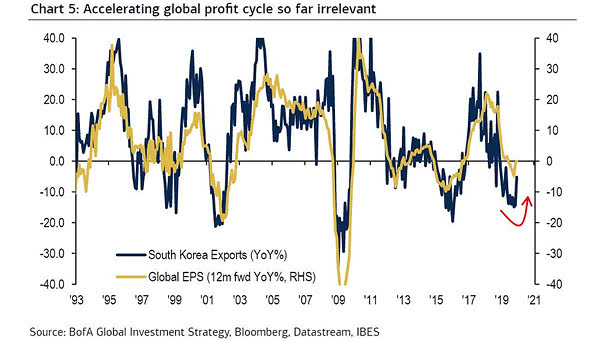
Global Profit Cycle – South Korea Exports and Global EPS Chart showing the correlation between South Korea exports and global EPS. Image: BofA Global Investment Strategy
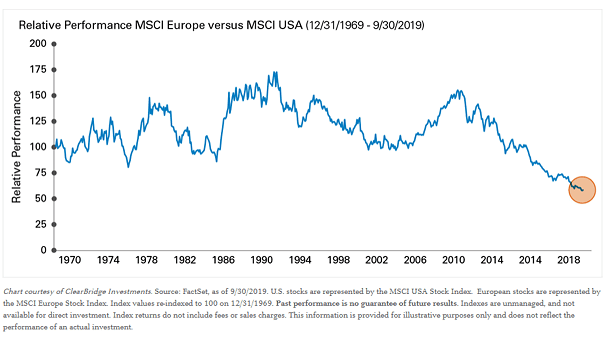
Relative Performance MSCI Europe vs. MSCI USA The relative performance of European stocks vs. the U.S. is at its lowest level in 50 years. Will this year be Europe’s time to outperform? Image: Legg Mason
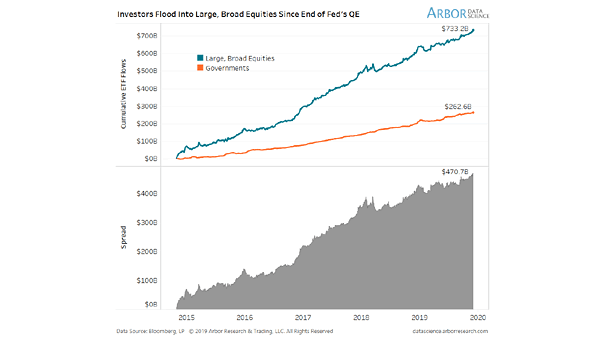
Cumulative ETF Flows Flows into equities and bonds have been very steady since 2015. Image: Arbor Research & Trading LLC
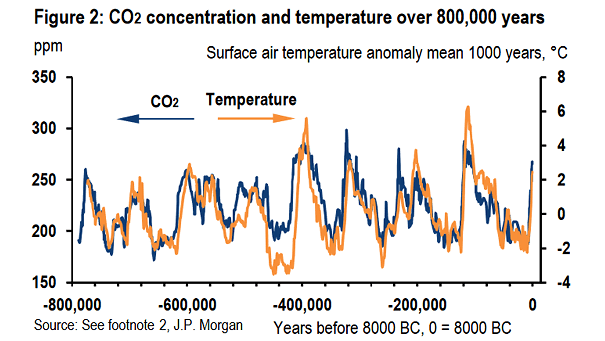
Climate – CO2 Concentration and Temperature over 800,000 Years This interesting chart shows the correlation between CO2 concentration and temperature over 800,000 years. Image: J.P. Morgan
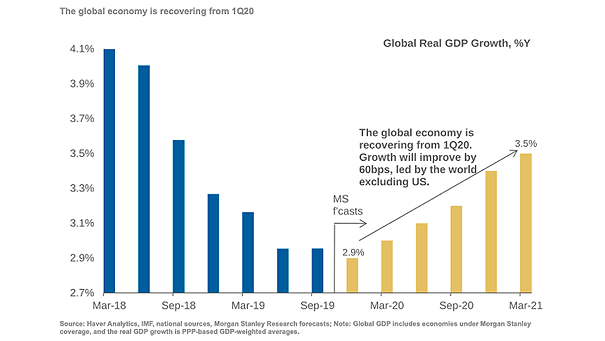
Global Economy and Global Real GDP Growth Morgan Stanley expects global growth to improve by 60 bps over 5 quarters. Image: Morgan Stanley Research
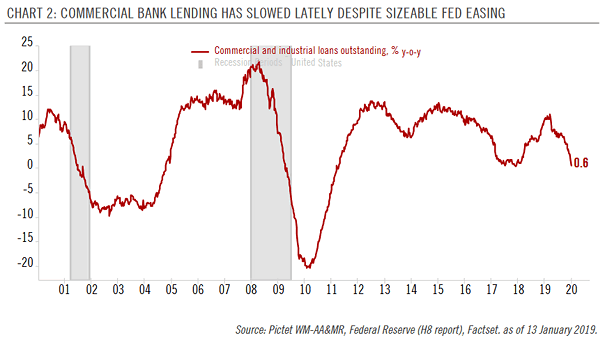
U.S. Commercial and Industrial Loans Outstanding Business loan growth is slowing down, despite Fed easing. Currently, liquidity is going into the financial markets, but not into the real economy. Image: Pictet Wealth Management
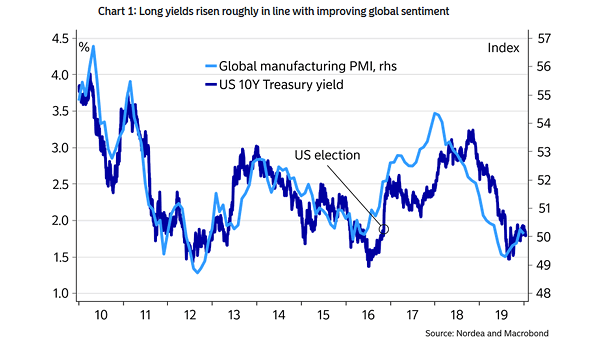
Global Manufacturing PMI and U.S. 10-Year Treasury Yield Chart suggesting that improving global sentiment drives U.S. 10-year Treasury yields higher. Image: Nordea and Macrobond
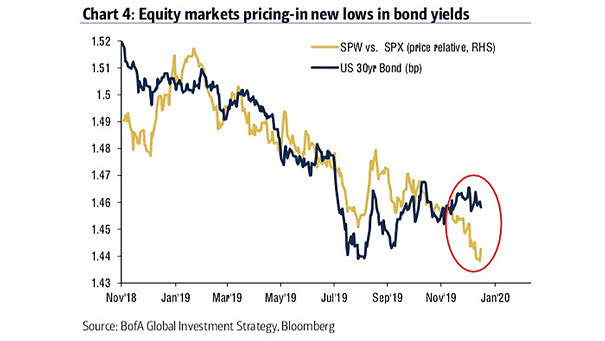
S&P 500 Equal Weight Index vs. S&P 500 (Price Relative) and U.S. 30-Year Bond Equity markets suggest new lows in bond yields. Image: BofA Global Investment Strategy
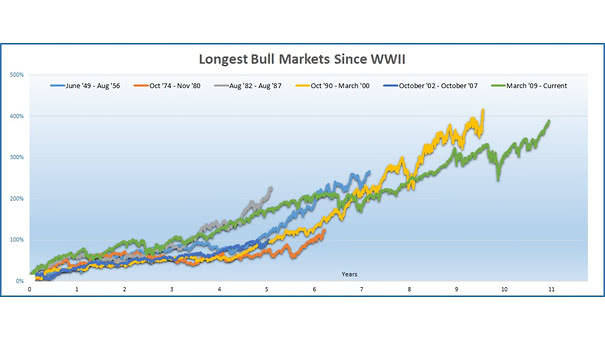
Longest U.S. Bull Markets Since WWII This chart puts the current bull market into perspective. Image: Ryan Detrick, LPL Financial LLC