Exports to China with Trade Deal Targets
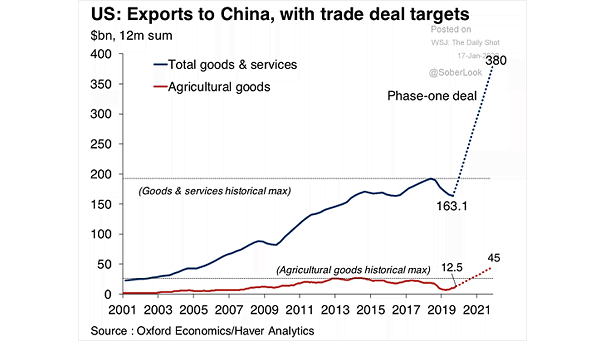
Exports to China with Trade Deal Targets This chart shows exports to China with trade targets, under the phase-one trade deal. Image: Oxford Economics
Exports to China with Trade Deal Targets This chart shows exports to China with trade targets, under the phase-one trade deal. Image: Oxford Economics
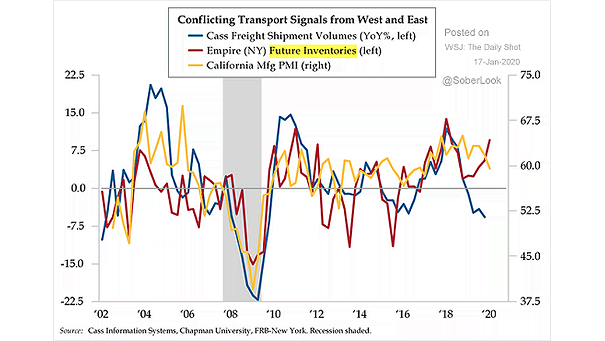
U.S. Freight Shipping Activity The New York Fed’s manufacturing report suggests a rebound in freight shipping activity this year. Image: Quill Intelligence, LLC
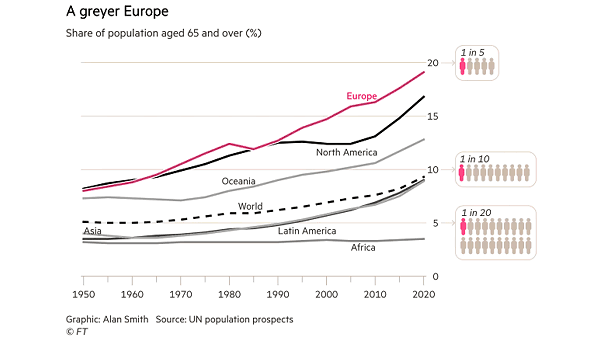
Demographics – Share of Population Aged 65 and Over While global population is aging, the population in Europe is aging rapidly. Image: Financial Times
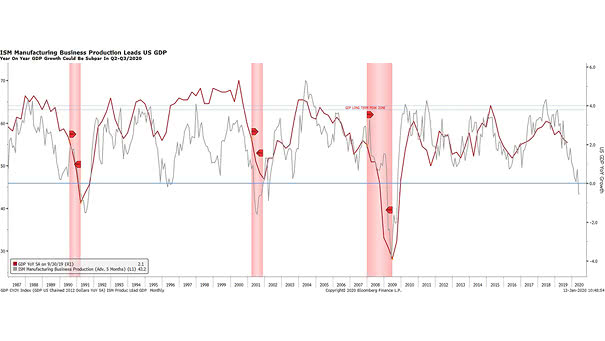
U.S. ISM Manufacturing Production Index Leads U.S. GDP Chart suggesting that the U.S. ISM Manufacturing Production Index leads U.S. GDP by 5 months. Image: Pictet Wealth Management
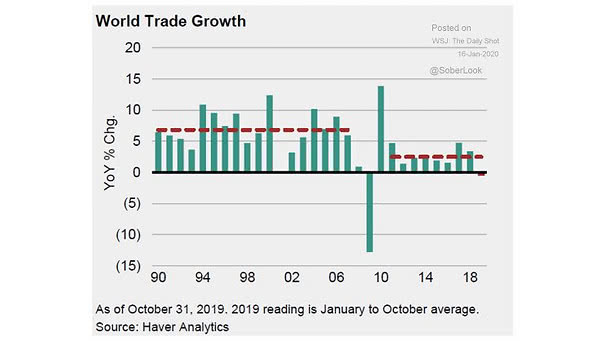
World Trade Growth Since 1990 In 2019, world trade growth fell to its lowest level since the global financial crisis. Image: Haver Analytics
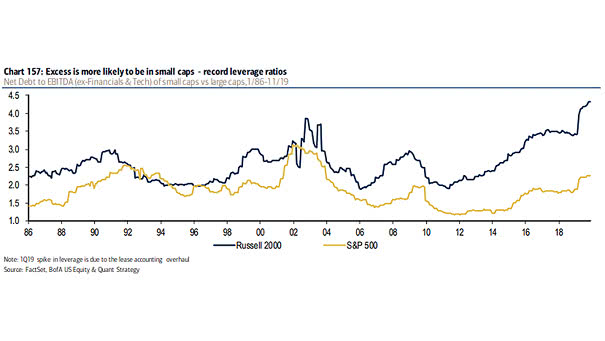
Leverage – Net Debt to EBITDA of Small Caps vs. Large Caps Excess leverage is more pronounced among U.S. small caps. Image: BofA US Equity & Quant Strategy
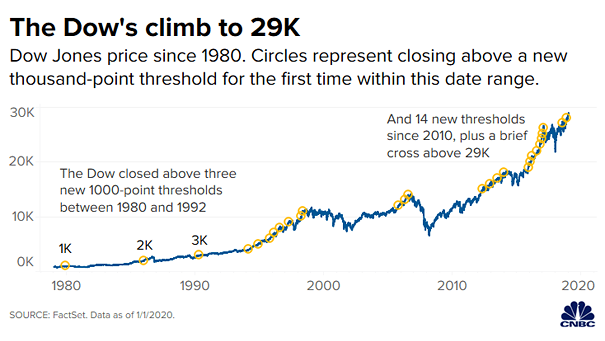
Dow Jones Price Since 1980 Historical chart of the Dow Jones from 1K to 29K. Image: CNBC
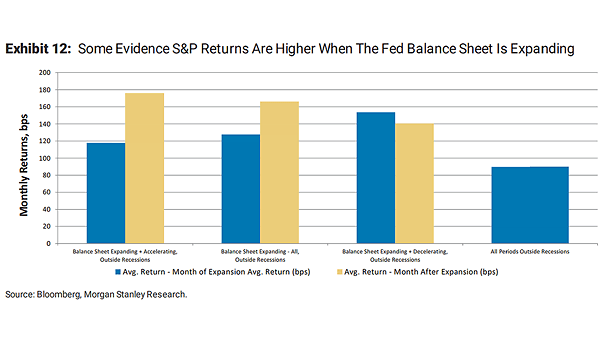
S&P 500 Returns and Fed Balance Sheet This chart suggests the positive relationship between the Fed’s balance sheet expansion and S&P 500 returns. Image: Morgan Stanley Research
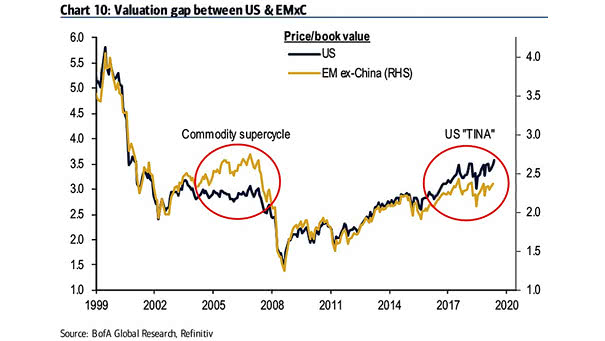
Valuation Gap Between U.S. and Emerging Markets ex-China According to BofA, emerging markets ex-China benefit from favorable demographics, modernization potential, and attractive valuations for the long term. Image: BofA Global Research
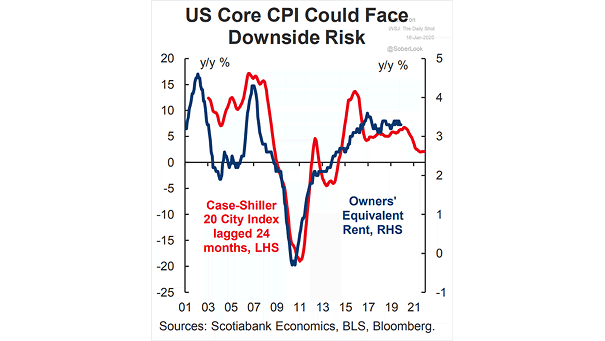
U.S. Core Inflation vs. Home Prices (Leading Indicator) Home prices suggest that core CPI seems likely to fall further. Image: Scotiabank Economics
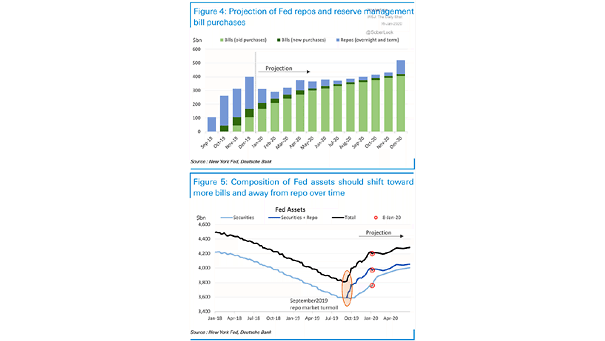
Fed’s Balance Sheet Composition Chart suggesting that the Fed should buy more Treasury bills and shift away from repo operations over time. Image: Deutsche Bank