
Gold vs. Fed Funds Futures
Gold vs. Fed Funds Futures Chart showing the current divergence between gold and the implied Fed funds rate. Image: Longview Economics
Gold vs. Fed Funds Futures Chart showing the current divergence between gold and the implied Fed funds rate. Image: Longview Economics
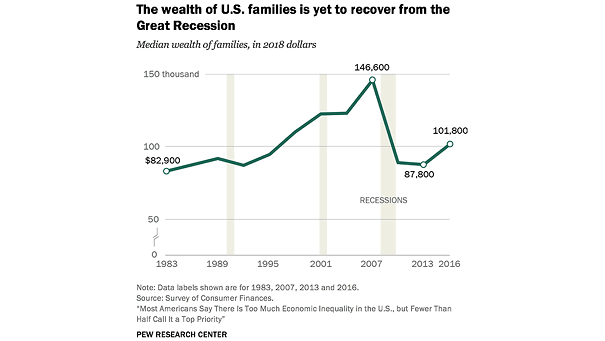
Inequality – Median Wealth of U.S. Families The median value of assets owned by an American family is no higher than it was 20 years ago. Image: PEW Research Center
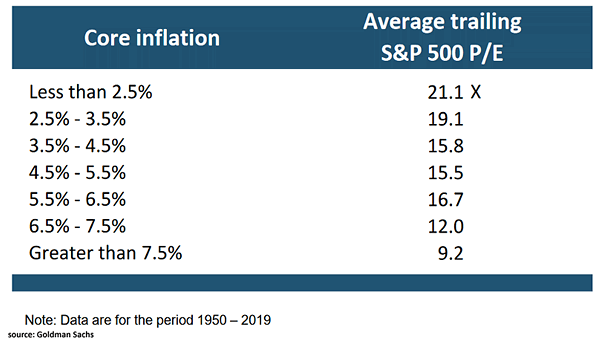
Core Inflation and Average Trailing S&P 500 P/E Ratio In periods of low inflation, the P/E ratio is higher. Conversely, high inflation tends to depress the P/E ratio. Image: Goldman Sachs Global Investment Research
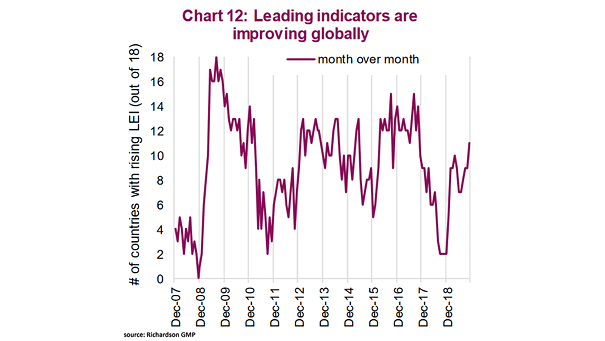
Leading Indicators Are Improving Globally Leading economic indicators have been improving throughout 2019. This may suggest that global growth is back on track. Image: Richardson Wealth
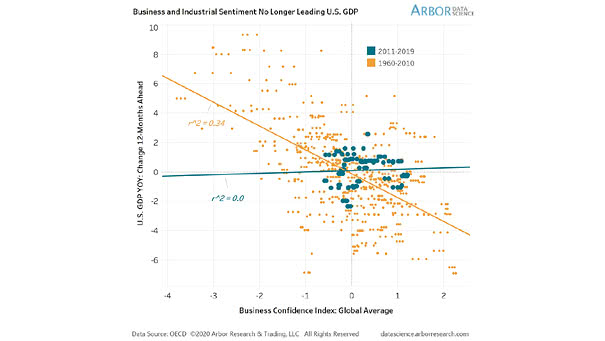
Business and Industrial Sentiment vs. U.S. GDP Chart suggesting that business and industrial surveys have not explained U.S. economic growth over the past decade (R² = 0). Image: Arbor Research & Trading LLC
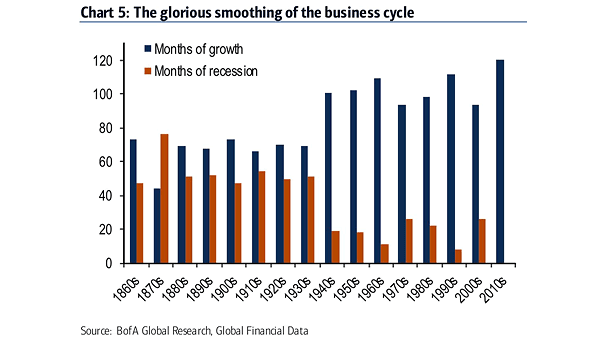
U.S. Business Cycle – Months of Growth vs. Months of Recession This chart puts into perspective the U.S. business cycle and the length of recessions. Image: BofA Global Research
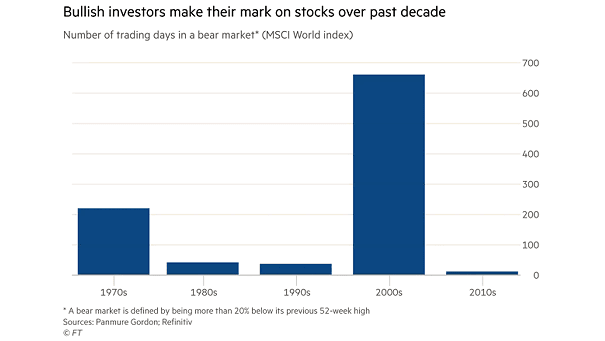
Number of Trading Days in a Bear Market (MSCI World Index) Stimulus and extremely low interest rates have moved global equities higher over past decade. Image: Financial Times
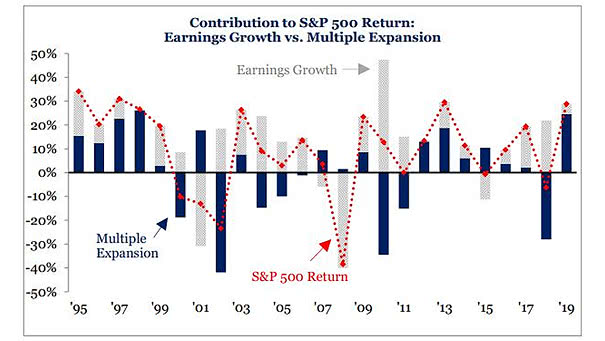
S&P 500 Return: Earnings Growth vs. Multiple Expansion Multiple expansion explains the S&P 500’s impressive total return of 31.49% in 2019, despite muted earnings. Image: Strategas
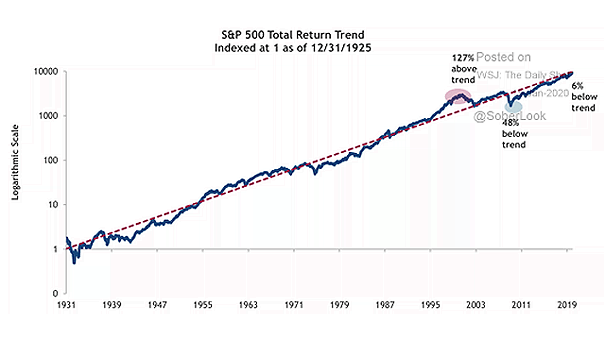
S&P 500 Total Return Trend Chart suggesting that the S&P 500 Total Return index is 6% below trend. Image: Truist
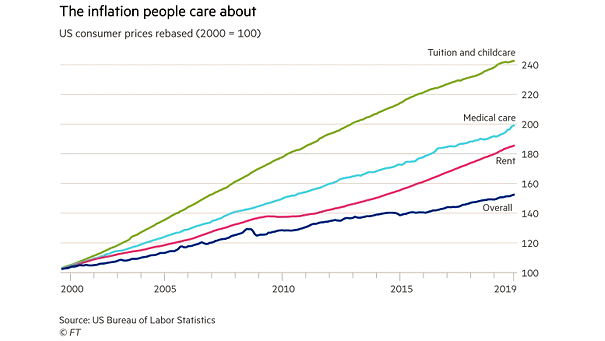
U.S. Inflation since 2000 U.S. households are more concerned about the rising cost of medical care and housing, than overall inflation. Image: Financial Times
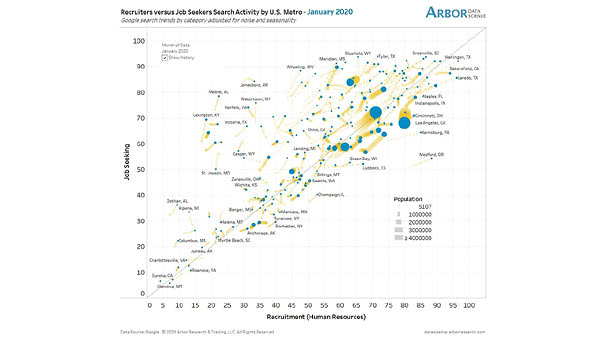
U.S. Job Seeking and Recruitment Lots of job hunting. This interesting chart shows Google searches by job-seekers vs. recruiters. Image: Arbor Research & Trading LLC