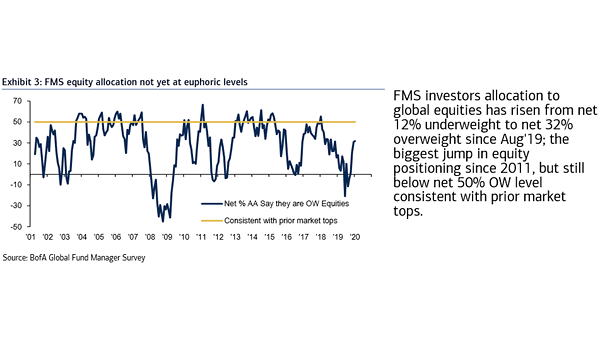
BofA’s Fund Manager Survey Global Equity Allocation
BofA’s Fund Manager Survey Global Equity Allocation FMS investors allocation to global equities is still below 50% level, consistent with prior market tops. Image: BofA Global Fund Manager Survey
BofA’s Fund Manager Survey Global Equity Allocation FMS investors allocation to global equities is still below 50% level, consistent with prior market tops. Image: BofA Global Fund Manager Survey
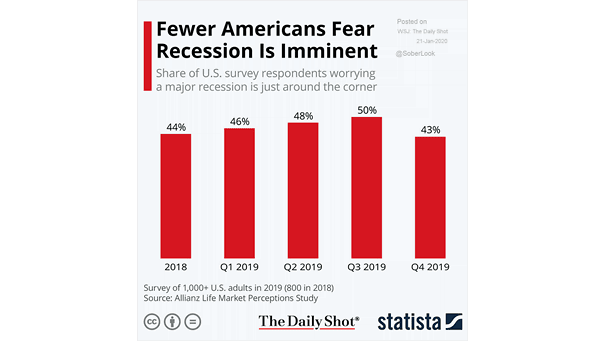
Survey – Fear of Recession in the United States Recession fears recede among Americans. Image: Statista
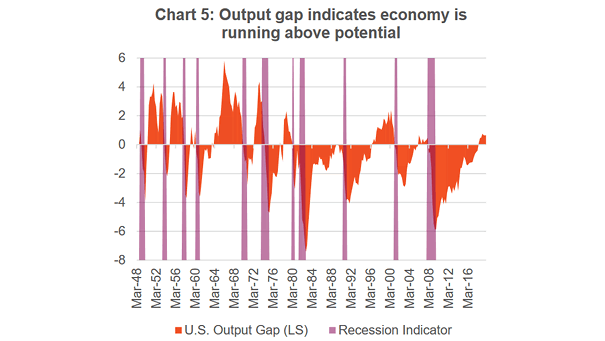
U.S. Output Gap and Inflation This chart shows that actual U.S. GDP is higher than potential GDP. Historically, a positive output gap leads to inflation. Image: Richardson Wealth
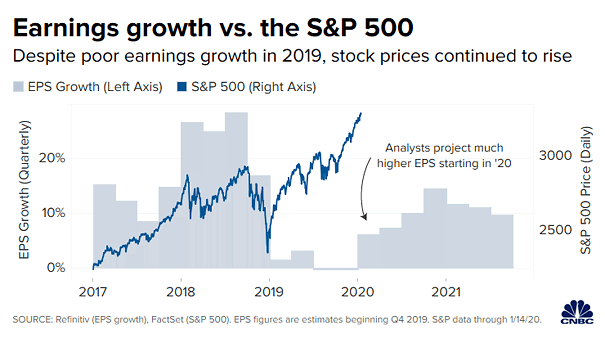
Earnings Growth and S&P 500 Rebound in earnings coming in 2020? Analysts expect a 9.5% jump this year. Image: CNBC

Cumulative U.S. Fund Flows since 2009 In terms of cumulative fund flows, this chart highlights the decade of U.S. bonds. Image: Fidelity Investments

Global Nominal GDP Growth: 2007 vs. 2019 This chart highlights how much nominal GDP has slowed between 2007 and 2019. Image: KKR Global Macro
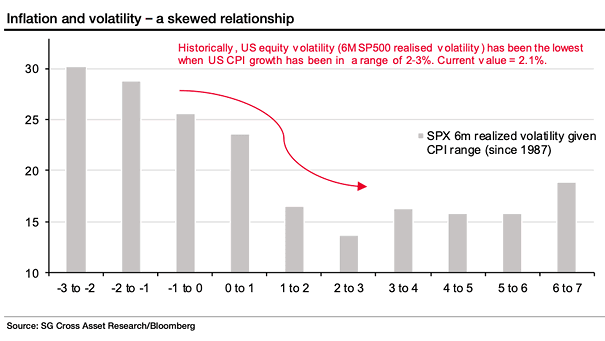
Inflation and S&P 500 6-Month Realised Volatility Since 1987, the S&P 500 6-month realised volatility has been the lowest, when U.S. CPI growth has been in the 2 to 3 per cent range. Image: Societe…
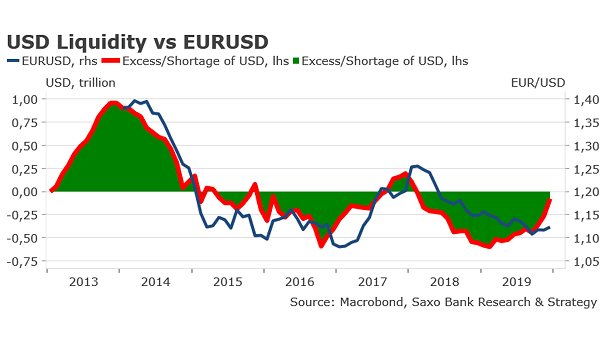
U.S. Dollar Liquidity vs. EUR/USD The inflow of U.S. dollar into the financial system should continue to grow this year and tends to support the euro against the US dollar. Image: Saxo Bank
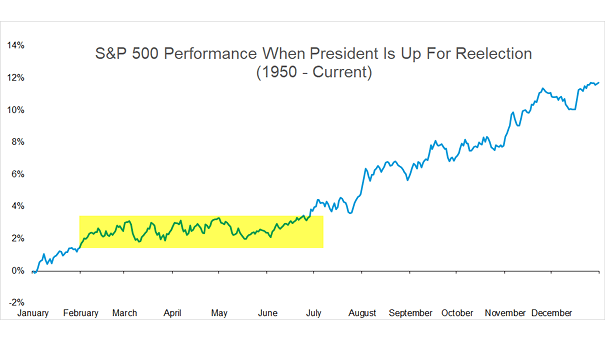
S&P 500 Performance When President Is Up For Reelection Since 1950, the S&P 500 has finished the year higher when a President has been up for reelection. Gains tend to occur in the second half…
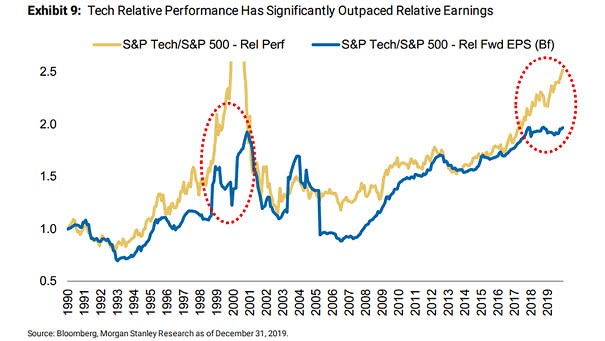
Tech Bubble – Tech Relative Performance vs. Relative Forward Earnings Another tech bubble? This chart shows that tech’s relative performance is disconnected from relative forward earnings. Image: Morgan Stanley Research
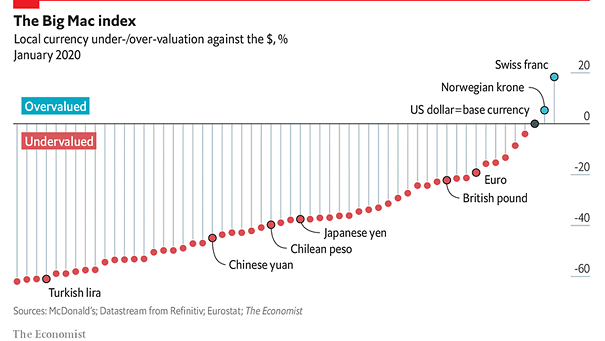
U.S. Dollar and the Big Mac Index The latest Big Mac index suggests that the U.S. dollar remains overvalued against most currencies. Image: The Economist