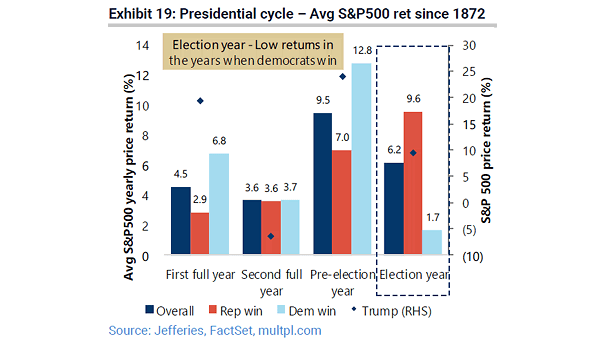
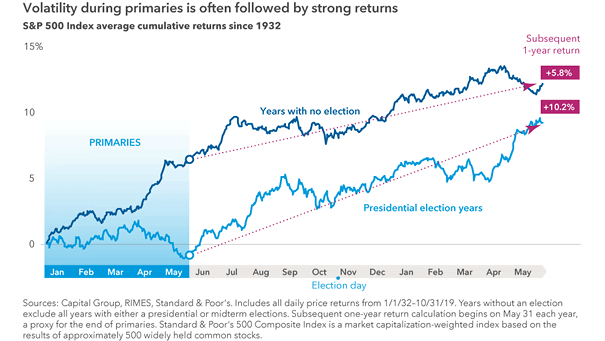
S&P 500 Total Return and Maximum Pullback
S&P 500 Total Return and Maximum Pullback In 2019, the S&P 500’s pullback (from peak to trough) of 6.8% was one of the smallest pullbacks in recent history. Image: Ryan Detrick, LPL Financial LLC
S&P 500 Net Debt vs. Share Buybacks U.S. companies are ramping up share buybacks. Funding is coming in part from a rise in debt. Image: Societe Generale Cross Asset Research
S&P 500 Volatility by Decade Volatility ended this decade at a lower level than the previous decade. Image: Reuters
Inequality – Monthly Income After Tax Minus Average Monthly Expenditures Greatest economy ever? Despite increasing wage growth and a low unemployment rate, half of the U.S. population spends more than their income. Image: Deutsche Bank…
S&P 500 Returns by Decade The S&P 500 closes the decade with nearly 190% gain. Image: Financial Times
S&P 500 Median Absolute Percentage Change by Day of the Year Chart showing that January 2 is the most volatile day of the year since 1930, with a median absolute change of 0.79%. Image: Bianco…
U.S. Real GDP Growth During Expansions The current business cycle is the longest, but it’s far from being the best. Image: Bloomberg
U.S. Unemployment Rate Forecast Goldman Sachs forecasts new lows in the U.S. unemployment rate in 2020. Image: Goldman Sachs Global Investment Research
Inequality – Share of National Net Worth Net worth inequality in the United States worsens. Images: Reuters
Annual Net Hedge Fund Openings Hedge funds are on track to record more closures than launches for the fifth consecutive year, due to mediocre returns and high fees. Image: Bloomberg
S&P 500 Average Monthly Returns Since 1950, the S&P 500 has been positive on average in January, but not over the past 10 & 20 years. Image: Ryan Detrick, LPL Financial LLC