
U.S. Unemployment Rate Forecast
U.S. Unemployment Rate Forecast Goldman Sachs forecasts new lows in the U.S. unemployment rate in 2020. Image: Goldman Sachs Global Investment Research
U.S. Unemployment Rate Forecast Goldman Sachs forecasts new lows in the U.S. unemployment rate in 2020. Image: Goldman Sachs Global Investment Research
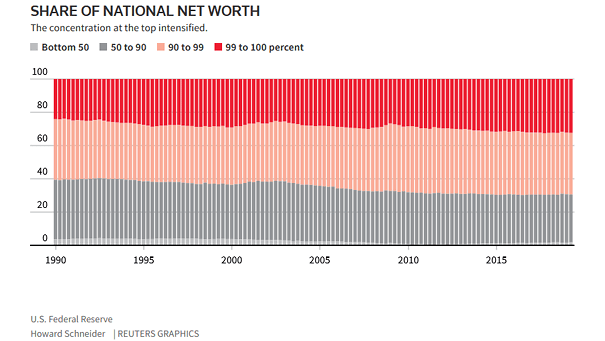
Inequality – Share of National Net Worth Net worth inequality in the United States worsens. Images: Reuters
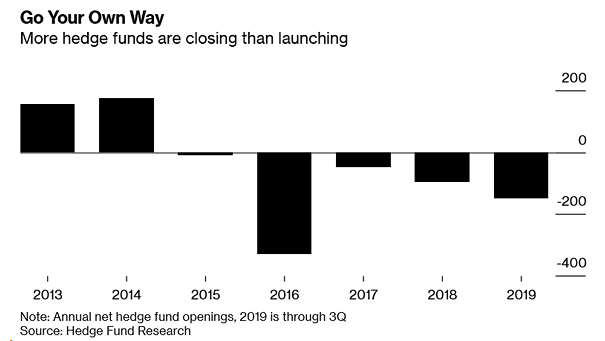
Annual Net Hedge Fund Openings Hedge funds are on track to record more closures than launches for the fifth consecutive year, due to mediocre returns and high fees. Image: Bloomberg
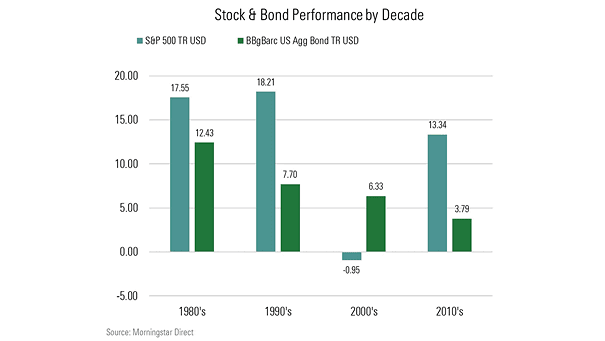
Historical Returns of Stocks and Bonds by Decade The next decade could see anemic returns, due to low growth, low yields and low inflation expectations. Image: Morningstar
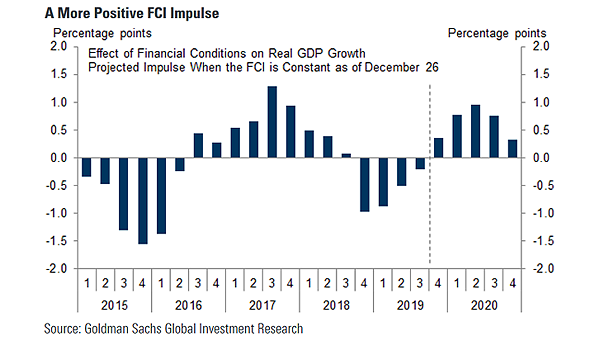
Effect of Financial Conditions on U.S. Real GDP Growth Chart suggesting an improvement of U.S. real GDP growth in 2020, as the impulse from financial conditions turns positive. Image: Goldman Sachs Global Investment Research
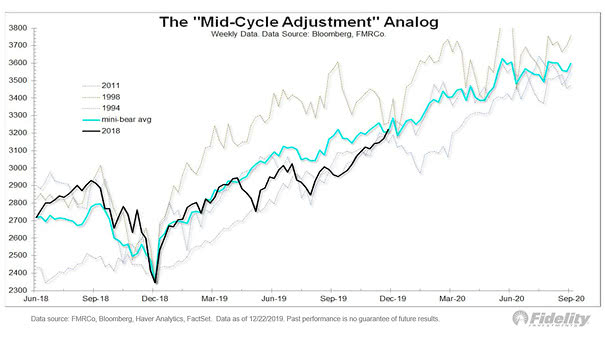
S&P 500 – The 1994-1998-2011 Mini-Bear Analog The “mid-cycle adjustment” analog works very well so far and suggests where the S&P 500 could go next. Image: Fidelity Investments
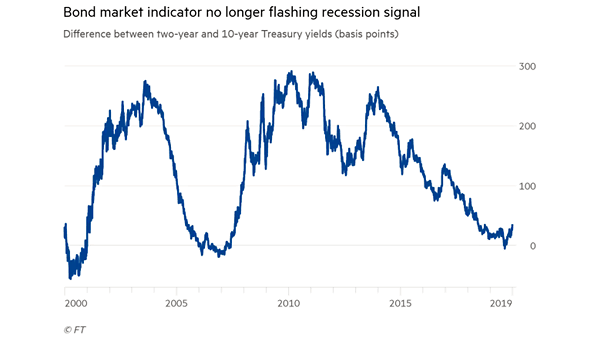
10Y-2Y Yield Curve and U.S. Recession The U.S. yield curve is steepening and suggests optimism for 2020, as investors become more confident in the U.S. economy. Image: Financial Times
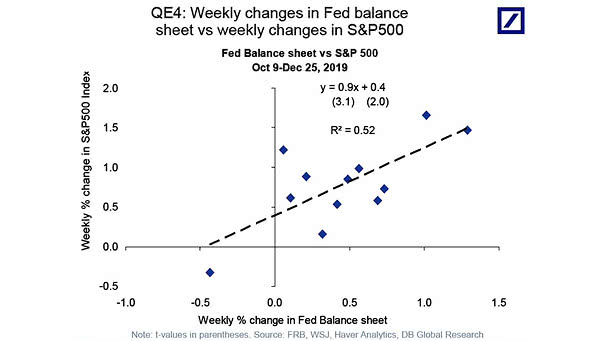
Fed Balance Sheet vs. S&P 500 Chart suggesting that since October 2019, a 1% increase in the Fed balance sheet has been associated with a 0.9% increase in the S&P 500, (R² = 0.52). Image: Deutsche Bank…
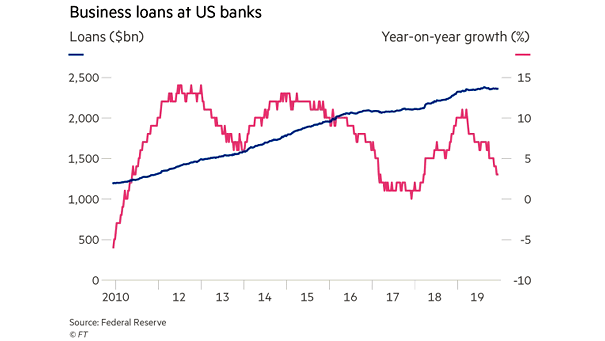
Business Loans at U.S. Banks Business loans at U.S. banks are tightly connected to the real economy and stalled in second half of this year. Image: Financial Times
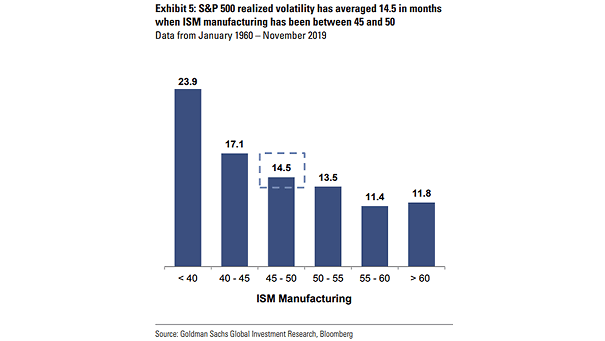
ISM Manufacturing Index and S&P 500 Realized Volatility Interesting chart suggesting the correlation between the S&P 500 realized volatility and the ISM Manufacturing Index. Image: Goldman Sachs Global Investment Research
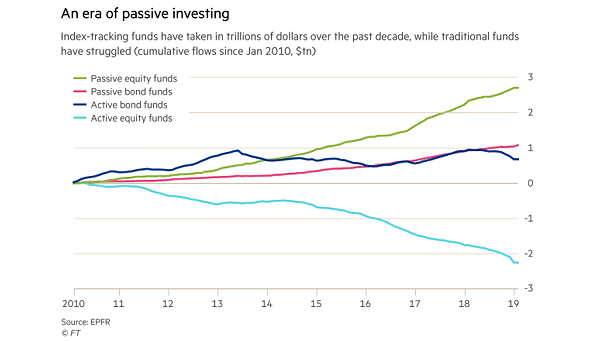
Passive Equity and Bond Funds vs. Active Equity and Bond Funds The popularity of passive investing through ETFs and index mutual funds has grown significantly since 2010. Image: Financial Times