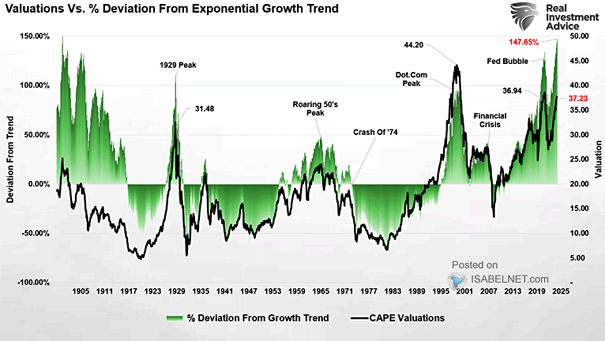
ISABELNET Cartoon of the Day

ISABELNET Cartoon of the Day Bears are preparing for the apocalypse, while bulls are partying like it’s 1999, convinced the U.S. economy is recession-proof—until it isn’t! Have a Great Day, Everyone! 😎

SPDR S&P 500 ETF Trust Three-Month 90/110 Implied Volatility

SPDR S&P 500 ETF Trust Three-Month 90/110 Implied Volatility Signs of stability are emerging in the S&P 500 Index after the sharp correction, as traders abandon bets on further significant declines, reflecting growing confidence in…

ISABELNET Cartoon of the Day

ISABELNET Cartoon of the Day Saint Patrick’s Day brings smiles to bulls as it’s not only one of the greenest days of the year but also historically the best day for U.S. stocks in March—leaving…

Aggregate Equity Positioning

Aggregate Equity Positioning Aggregate equity positioning has declined sharply and stands at 26th percentile, indicating investors’ markedly reduced willingness to take on risk. Image: Deutsche Bank Asset Allocation

Risky vs. Safe Assets Fund Flows

Risky vs. Safe Assets Fund Flows The ongoing preference for safe assets over risky ones indicates investor wariness about market conditions and a focus on capital preservation in uncertain times. Image: Goldman Sachs Global Investment…

S&P 500 Index Max Pullback per Calendar Year

S&P 500 Index Max Pullback per Calendar Year Corrections can be unsettling for investors but don’t always signal a more severe downturn. Since 1980, the S&P 500 has had 16 corrections that didn’t lead to…

Performance – Gold vs. S&P 500

Performance – Gold vs. S&P 500 Warren Buffett has a skeptical view of gold as an investment, but apparently, gold didn’t get the memo and has been outperforming the S&P 500 this century! Image: Bloomberg

Periods of S&P 500 Correction Above 10%

Periods of S&P 500 Correction Above 10% Due to the U.S. stock market’s dominant position, a correction exceeding 10% frequently triggers a domino effect across global equity markets, as investors react to heightened uncertainty and…