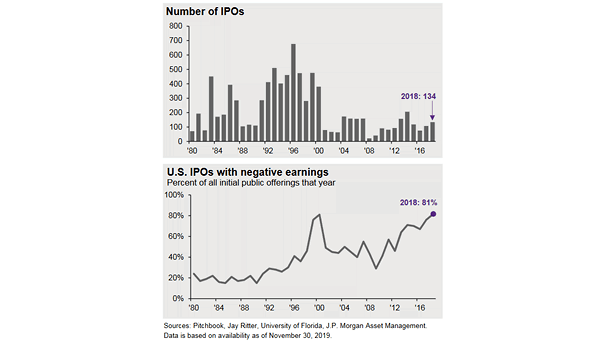
10-Year Annualized Real S&P 500 Total Return

10-Year Annualized Real S&P 500 Total Return This chart puts into perspective the 10-year annualized real S&P 500 Total Return (adjusted for inflation). Image: Bianco Research

Rotation vs. U.S. GDP Growth Forecasts

Rotation vs. U.S. GDP Growth Forecasts Chart suggesting that the rotation out of bonds into equities, out of growth into cyclicals, out of large caps into small caps, and out of gold into copper, is…

Number of Countries in Each Cycle Stage

Number of Countries in Each Cycle Stage Chart suggesting that the global synchronised slowdown is over. According to the OECD leading indicators, the number of countries in recovery is rising. Image: TS Lombard

U.S. Stock Market Breadth

U.S. Stock Market Breadth The US stock market breadth is improving and continues to drive stocks higher. Image: Fidelity Investments

MSCI Europe Relative to S&P 500

MSCI Europe Relative to S&P 500 The relative range between the MSCI Europe Index and the S&P 500 has been broken since the European financial crisis. Since 2011, European equities have underperformed the U.S. at…

S&P 500 Average Return in December

S&P 500 Average Return in December Historically, the S&P 500 has done well in the second half of December. Image: LPL Research