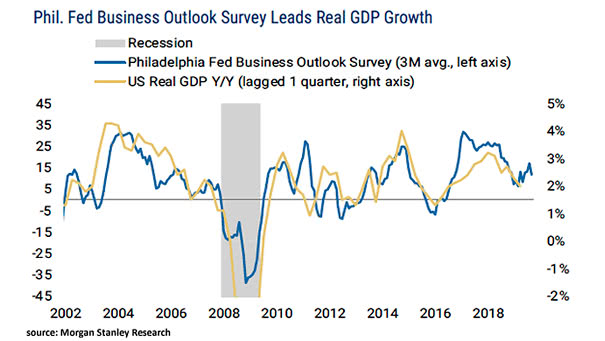
U.S. and Global Real GDP Growth

U.S. and Global Real GDP Growth Chart suggesting a rebound in global growth outside the United States. Image: Morgan Stanley Research

U.S. Corporate CCC-Rated Bonds Diverge During Trade War

U.S. Corporate CCC-Rated Bonds Diverge During Trade War As the chart suggests, CCC-rated bonds are not the canary in the coal mine. The divergence in option-adjusted spreads between CCCs and higher-rated issues reflects the impact…

Valuation – Forward P/E Ratio

Valuation – Forward P/E Ratio From the valuation peak of January 2018, most P/E ratios have seen drawdowns of 20%-30%, making this feel like a bear market. Image: Fidelity Investments

U.S. Dollar and S&P 500 vs. MSCI World ex-U.S.

U.S. Dollar and S&P 500 vs. MSCI World ex-U.S. BofAML suggests that the outlook for the U.S. dollar remains bullish into 2020, but if the S&P 500 is to top out relative to the rest…

S&P 500 Price to Book Value vs. Future Returns

S&P 500 Price to Book Value vs. Future Returns The current S&P 500 price to book value suggests that equity market returns will be low over the next 10 years (R² = 0.86). Image: Tomasz…

S&P 500 Levels, Bank Projections

S&P 500 Levels, Bank Projections Morgan Stanley is a bear, but Wall Street expects gains for the S&P 500 in 2020 Image: Financial Times