Russell 2000 Returns After New 52-Week Highs
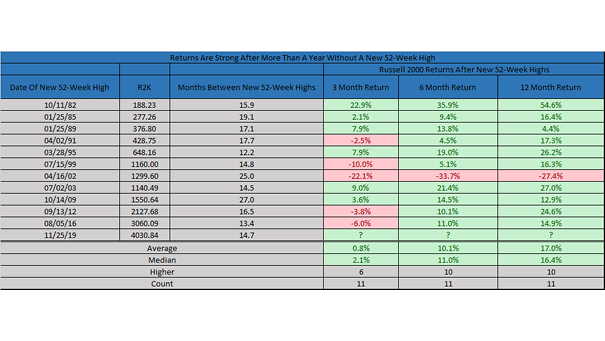
Russell 2000 Returns After New 52-Week Highs After more than a year without a new 52-week high, the Russell 2000 has been higher 12 months later 10 of 11 times and up 17% on average.…
Russell 2000 Returns After New 52-Week Highs After more than a year without a new 52-week high, the Russell 2000 has been higher 12 months later 10 of 11 times and up 17% on average.…
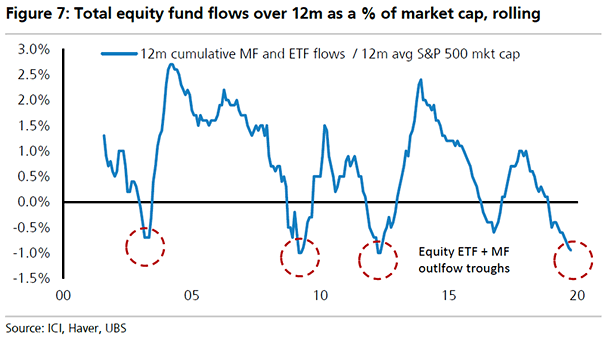
Total U.S. Equity Fund Flows and Market Capitalization Currently, equity fund outflows over 12m (rolling) are at 1% of market capitalization, as in March 2003, March 2009 and June 2012. Image: UBS
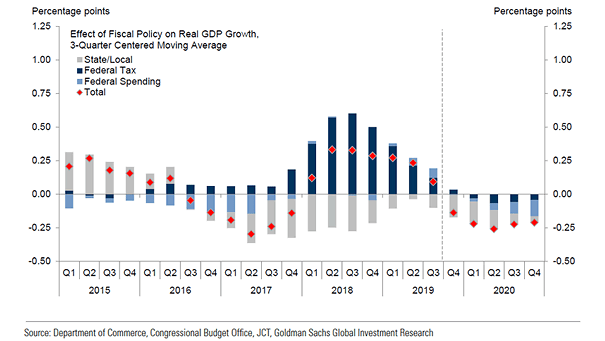
Effect of Fiscal Policy on U.S. Real GDP Growth This chart suggests a negative effect of fiscal policy on real GDP growth in 2020. Image: Goldman Sachs Global Investment Research
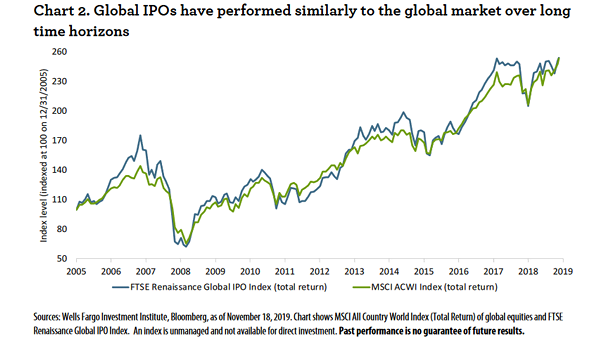
FTSE Renaissance Global IPO Index and MSCI ACWI Index This chart shows that global IPOs overall have performed similarly with the overall global equity market. Image: Wells Fargo Investment Institute
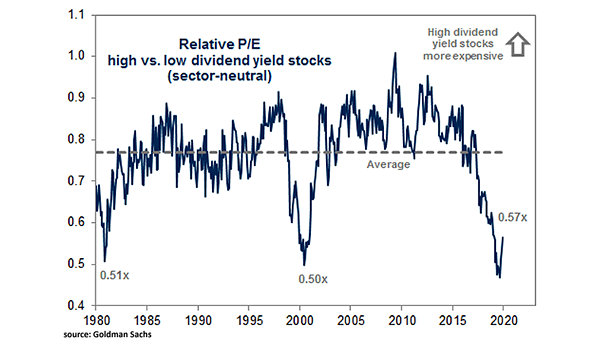
Valuation – Relative P/E High vs. Low Dividend Yield Stocks This chart suggests that stocks that pay large dividends haven’t been so cheap since around 1980, relative to low dividend yield stocks. Image: Goldman Sachs…
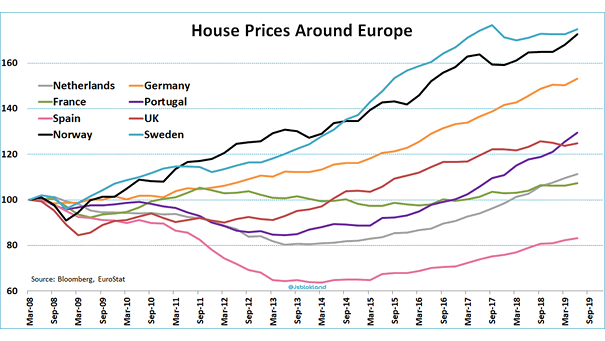
House Prices Around Europe Chart showing house prices around Europe since the Great Financial Crisis. House prices in Norway and Sweden have been on a high rising trend. Image: Jeroen Blokland
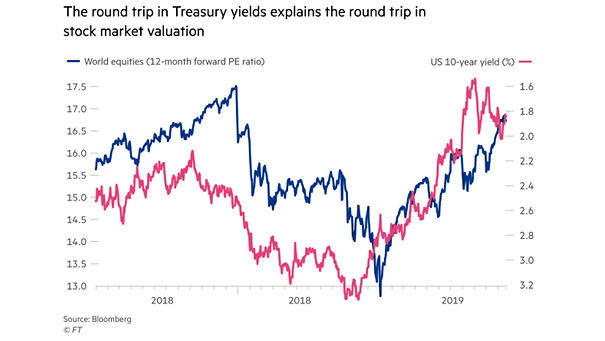
World Equities and U.S. 10-Year Treasury Yield Chart suggesting that the round trip in U.S. Treasury yields explains the round trip in stock market valuation. Image: Financial Times
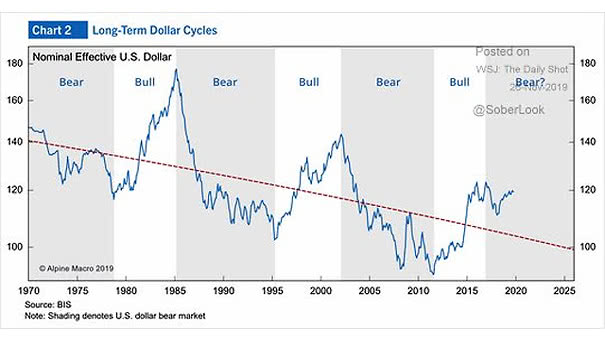
Long-Term U.S. Dollar Cycles This chart shows bear and bull cycles in the U.S. dollar. Will the U.S. dollar enter a bear market? Image: Alpine Macro
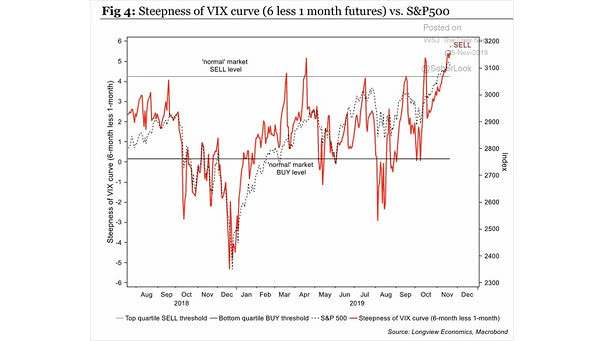
Steepness of VIX Curve vs. S&P 500 This chart suggests a warning sign for the S&P 500. Image: Longview Economics
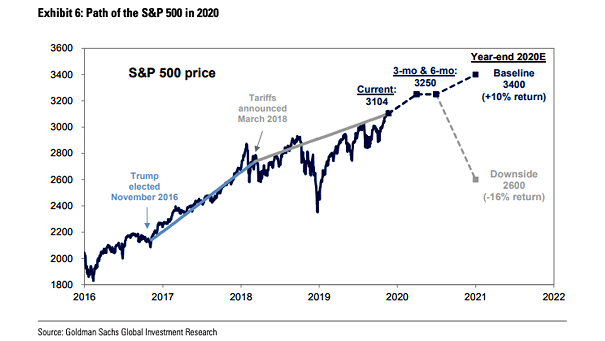
S&P 500 Forecast for 2020 Goldman Sachs forecasts a price-target for the S&P 500 at 3400 by year-end 2020, and a downside scenario at 2600 depending on tariffs and the US election result. Image: Goldman…
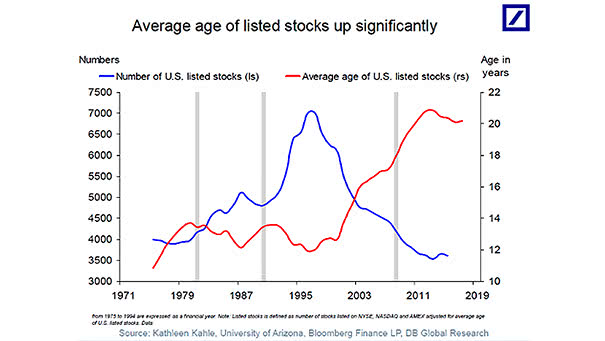
Number of U.S. Listed Stocks and Average Age of U.S. Listed Stocks The U.S. stock market is shrinking. The number of firms listed on U.S. stock exchanges has fallen by nearly 50% since 1996. Image:…