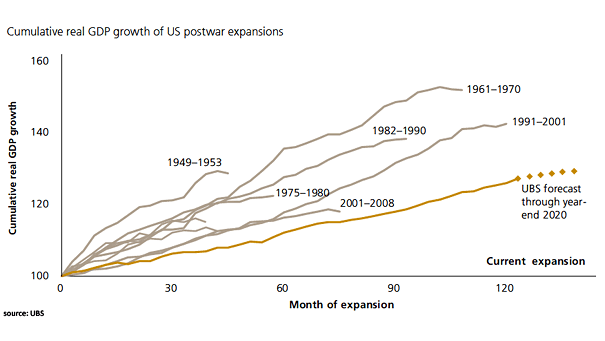
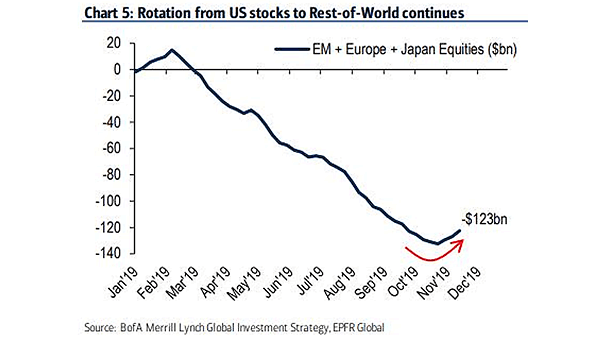
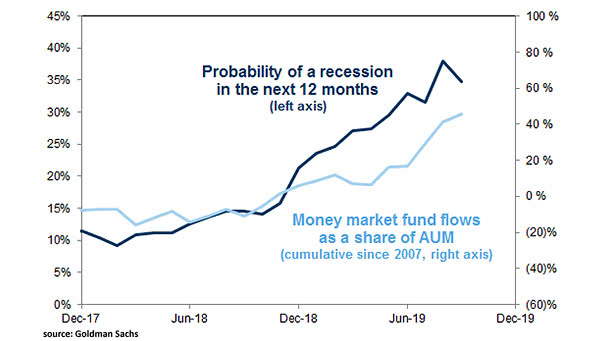
U.S. and Euro Area Composition of Corporate Credit

U.S. and Euro Area Composition of Corporate Credit Great chart showing that the U.S. is a market-based financial system, while the Euro Area is a bank-based system with 80% of bank loans. Image: Deutsche Bank…

Global Economic Cycle

Global Economic Cycle This chart suggests where countries stand in the current economic cycle. Image: Moody’s Analytics

Fear & Greed Index vs. S&P 500 RSI

Fear & Greed Index vs. S&P 500 RSI Chart suggesting a good correlation between the Fear & Greed Index and the S&P 500’s RSI. Image : CNN and MacroTechnicals

U.S. Real GDP Growth Forecasts

U.S. Real GDP Growth Forecasts Is the consensus wrong? The consensus expects U.S. real GDP growth of 1.8% in 2020 vs. 2.1% for Goldman Sachs. Image: Goldman Sachs Global Investment Research

Gold and U.S. 10-Year Treasury Yield

Gold and U.S. 10-Year Treasury Yield Risk sentiment in the market has improved and investors shift away from gold, while U.S. equities have reached new all-time highs. Image: U.S. Global Investors

Global Debt by Sector and Recession Risk

Global Debt by Sector and Recession Risk With global growth slowing, this chart suggests that the biggest recession risk is corporate deleveraging. Image: BofA Merrill Lynch Global Investment Strategy

Global Air Travel – CO2 Emission

Global Air Travel – CO2 Emission In 2018, annual global passenger numbers rose 7% to 4.4 billion and could double by 2037. Image: Financial Times

U.S. Misery Index (Unemployment Rate + Core Inflation)

U.S. Misery Index (Unemployment Rate + Core Inflation) The misery index is an economic indicator, created by economist Arthur Okun. Because both inflation and unemployment are very low, the U.S. misery index (unemployment rate +…