U.S. and China – Effect of the Trade War on Real GDP Growth
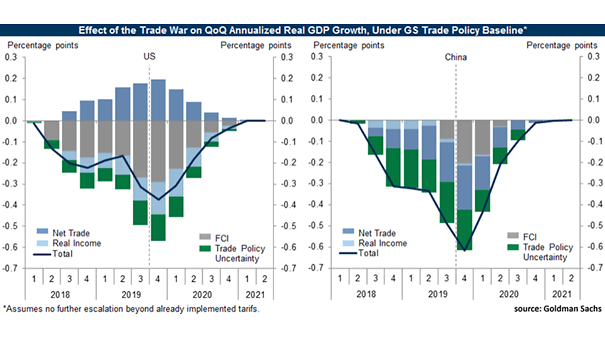
U.S. and China – Effect of the Trade War on Real GDP Growth Assuming no further escalation, the trade war drag on real GDP growth is expected to peak in Q4 2019. Image: Goldman Sachs…
U.S. and China – Effect of the Trade War on Real GDP Growth Assuming no further escalation, the trade war drag on real GDP growth is expected to peak in Q4 2019. Image: Goldman Sachs…
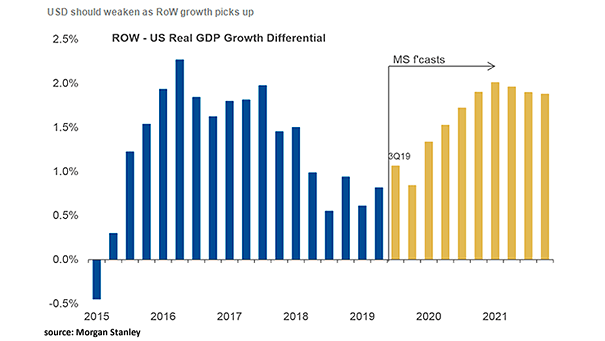
U.S. Dollar and ROW – U.S. Real GDP Growth Differential Chart suggesting that a rebound in global growth outside the U.S., should weaken the U.S. dollar. Image: Morgan Stanley Research
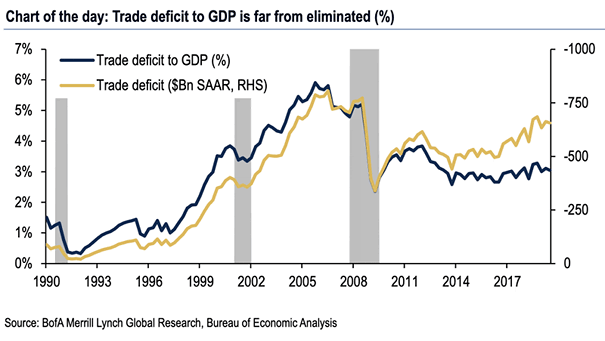
U.S. Trade Deficit to GDP The chart shows that the U.S. trade deficit as percentage of gross domestic product is still huge, despite the US-China trade war. Image: BofA Merrill Lynch Global Research
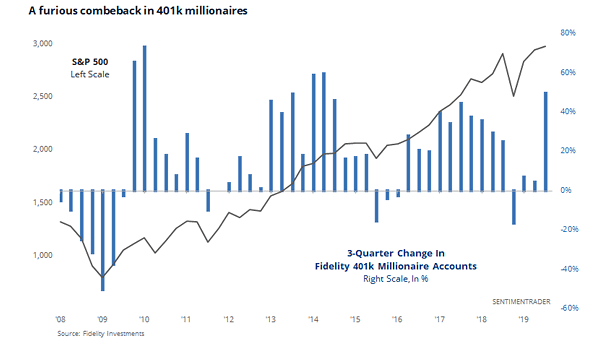
S&P 500 and Fidelity 401(K) Millionaire Accounts The number of 401(k) millionaires hits record high at the end of the third quarter, while the average 401(k) balance is still only $105,200. Image: Sentimentrader
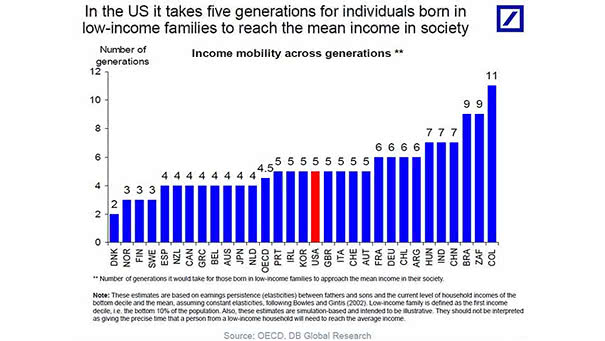
Inequality – Income Mobility Across Generations In the United States, it takes five generations for individuals born in low-income families to reach the mean income in society. In Danemark, it takes “only” two generations. Image:…
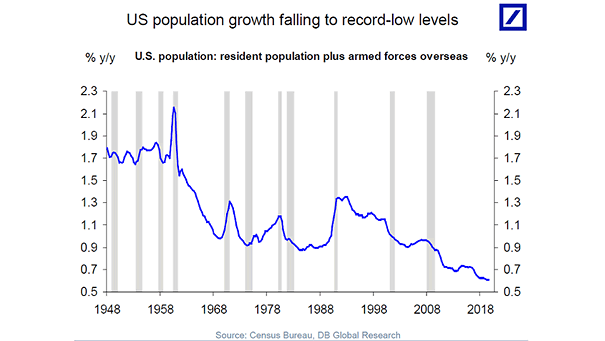
Demographics – U.S. Population Growth The U.S. population continues to grow today, but it is growing at the slowest rate since 1937. This means an aging, slow-growing future for the U.S..
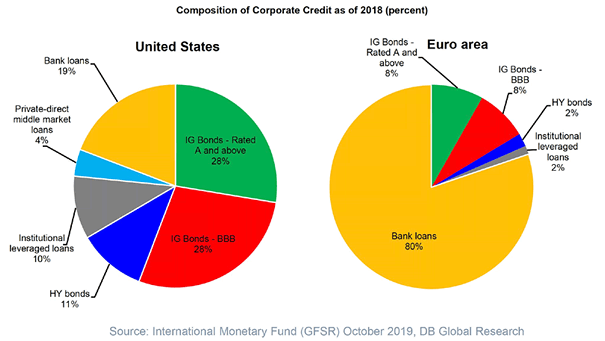
U.S. and Euro Area Composition of Corporate Credit Great chart showing that the U.S. is a market-based financial system, while the Euro Area is a bank-based system with 80% of bank loans. Image: Deutsche Bank…
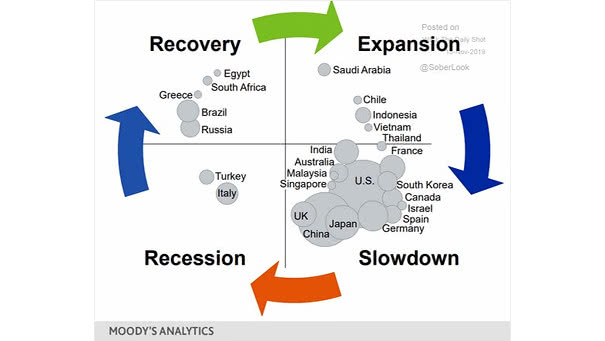
Global Economic Cycle This chart suggests where countries stand in the current economic cycle. Image: Moody’s Analytics
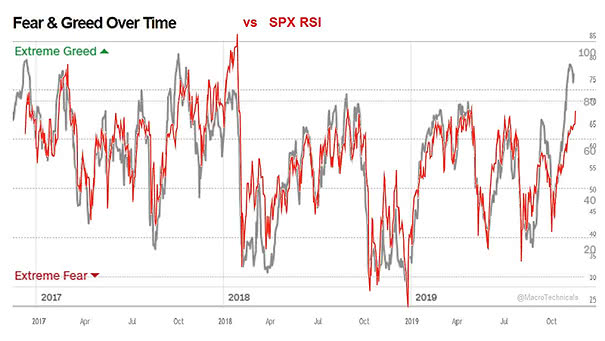
Fear & Greed Index vs. S&P 500 RSI Chart suggesting a good correlation between the Fear & Greed Index and the S&P 500’s RSI. Image : CNN and MacroTechnicals
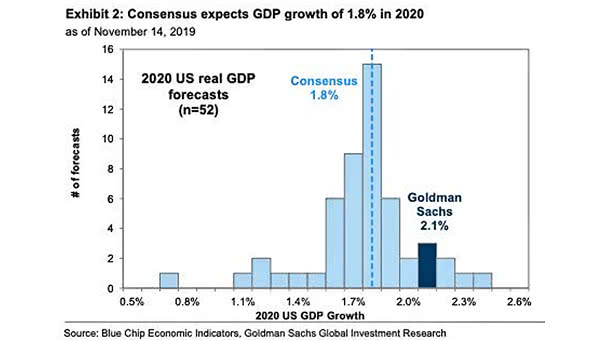
U.S. Real GDP Growth Forecasts Is the consensus wrong? The consensus expects U.S. real GDP growth of 1.8% in 2020 vs. 2.1% for Goldman Sachs. Image: Goldman Sachs Global Investment Research
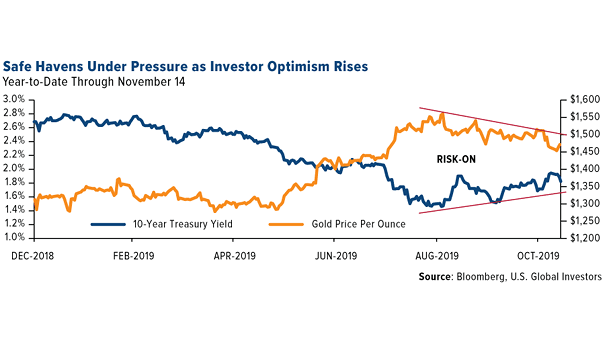
Gold and U.S. 10-Year Treasury Yield Risk sentiment in the market has improved and investors shift away from gold, while U.S. equities have reached new all-time highs. Image: U.S. Global Investors