Private Sector Debt
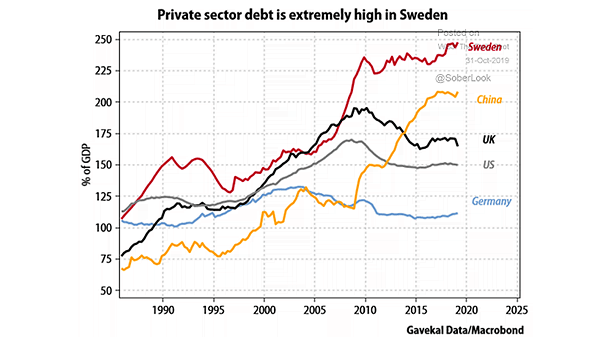
Private Sector Debt Private sector debt is high in China, extremely high in Sweden, and continues to rise. Source: Gavekal
Private Sector Debt Private sector debt is high in China, extremely high in Sweden, and continues to rise. Source: Gavekal
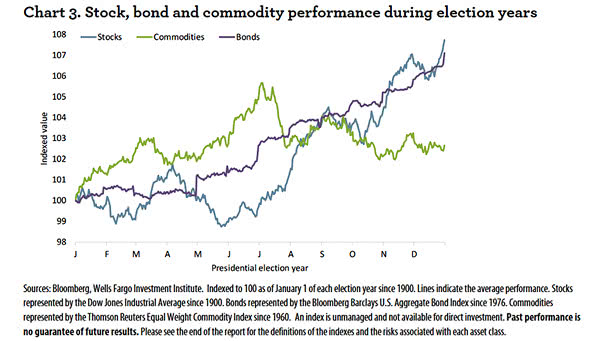
Stocks, Bonds and Commodities Performance During U.S. Presidential Election Years Historically, since 1900, stocks and bonds have struggled in the first half of U.S. presidential election years. Image: Wells Fargo Investment Institute
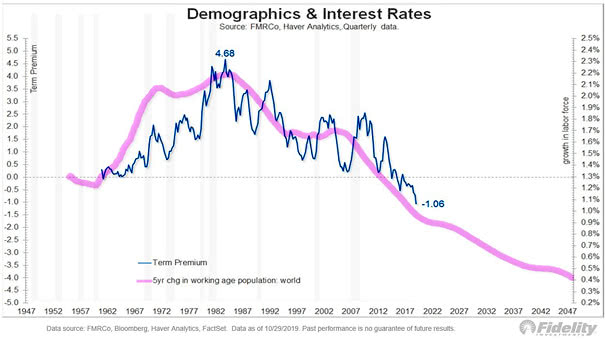
Demographics – Labor Force Growth and Term Premium Chart suggesting that growth in the labor force could explain the term premium. The term premium is the risk premium (or the bonus) that investors receive for…
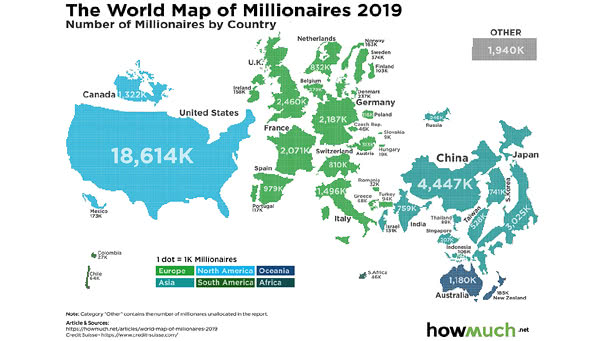
Inequality – Number of Millionaires by Country How many millionaires are in the U.S.? 18,614K millionaires, more than any other country in the world. Image: howmuch.net
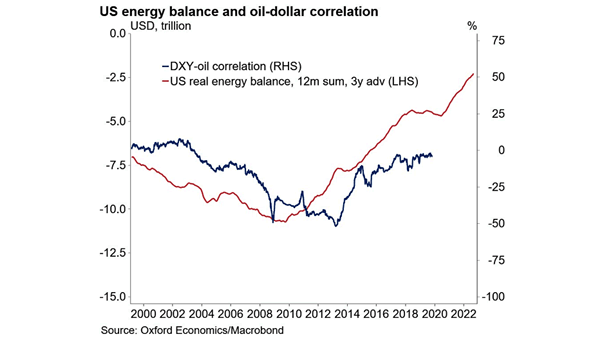
U.S. Energy Balance Leads Oil-Dollar Correlation Interesting chart suggesting that the U.S. real energy balance leads the oil-dollar correlation by three years. Image: Oxford Economics, Macrobond
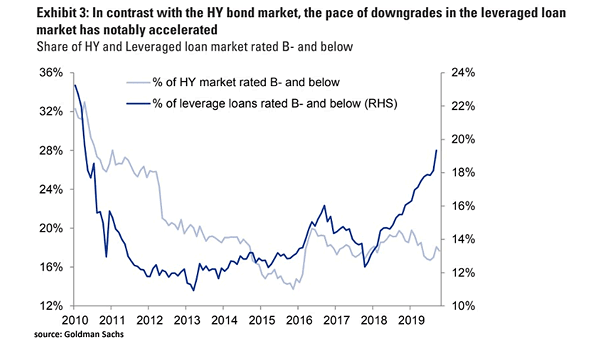
U.S. High Yield Bonds and Leverage Loans The pace of downgrades has accelerated in the U.S. leveraged loan market, despite declining interest rates. Image: Goldman Sachs Global Investment Research
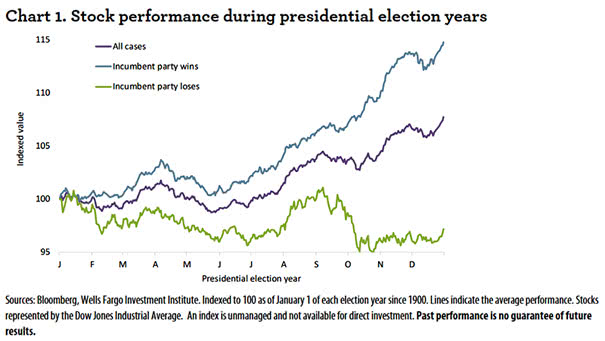
U.S. Stock Market Performance During U.S. Presidential Election Years Chart showing the average performance of the Dow Jones Industrial Average during U.S. presidential election years, since 1900. Image: Wells Fargo Investment Institute
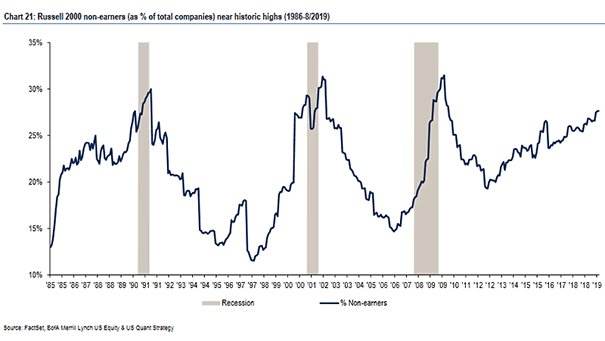
Russel 2000 and Unprofitable Small Caps The proportion of small caps that are unprofitable has climbed to nearly 30%. This level is generally only observed during recessions. Image: BofA Merrill Lynch Global Research
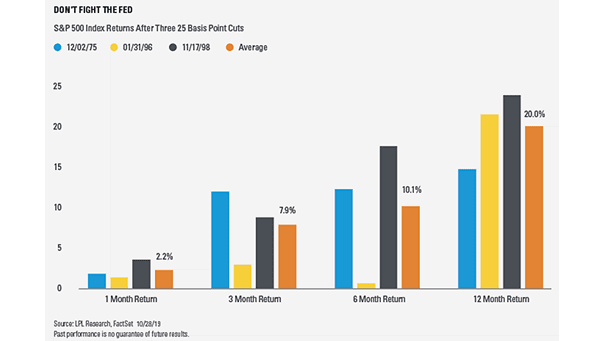
S&P 500 Index Returns After Three 25 Basis Point Rate Cuts After three rate cuts of 25 basis points in 1975, 1996 & 1998, the S&P 500 was, on average, up more than 10% six…
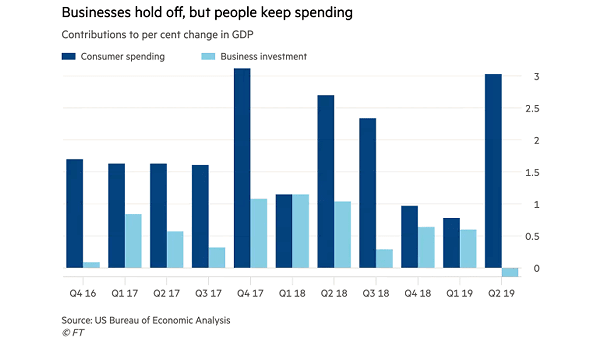
U.S. Consumer Spending, Business Investment and U.S. GDP Right now, consumer spending is the driving force behind the U.S. economy. Image: Financial Times
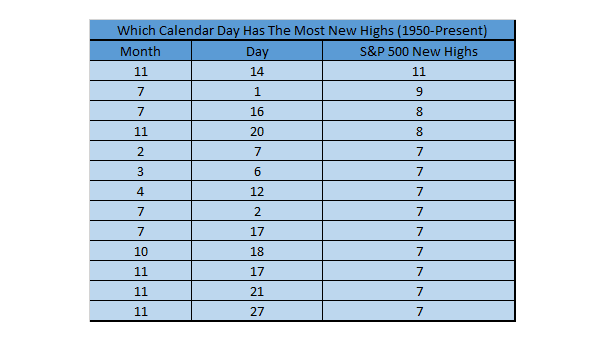
S&P 500 New Highs Since 1950, November 14 has the most S&P 500 new highs ever at 11. Image: Ryan Detrick, LPL Financial LLC