Global Negative Yielding Debt Index
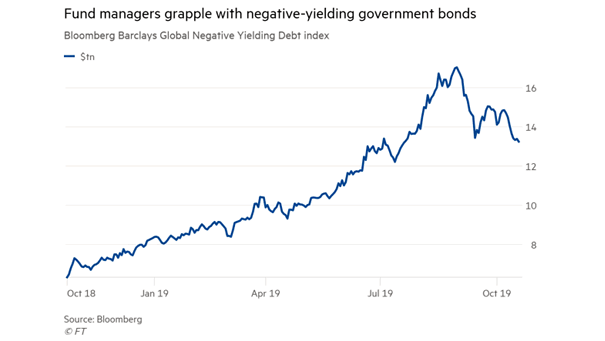
Global Negative Yielding Debt Index Global negative-yielding debt has now fallen below the 2016 peak. Image: Financial Times
Global Negative Yielding Debt Index Global negative-yielding debt has now fallen below the 2016 peak. Image: Financial Times
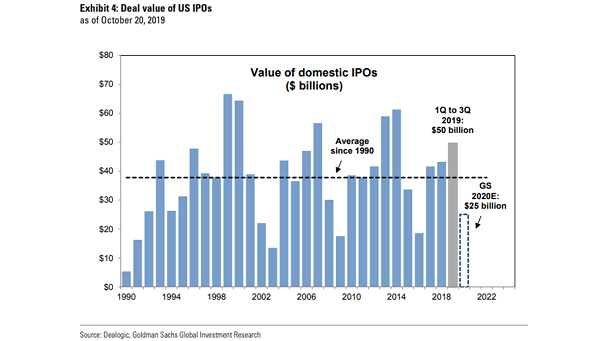
Deal Value of U.S. IPOs Goldman Sachs expects $25 billion of U.S. IPOs in 2020, less than the $40 billion average since 1990. Image: Goldman Sachs Global Investment Research
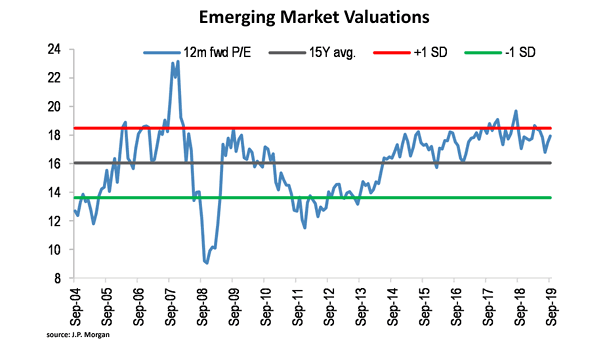
Emerging Market Valuations Chart suggesting that emerging market valuations are not cheap for bargain investors. Image: J.P. Morgan
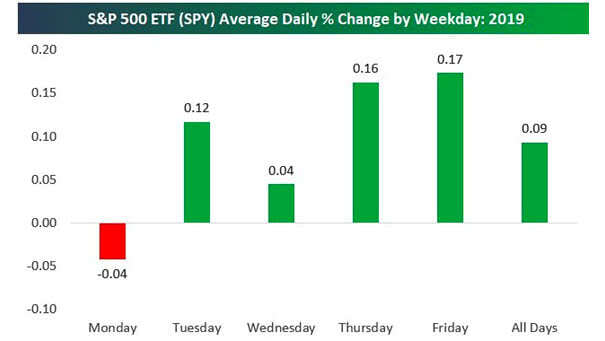
S&P 500 ETF (SPY) Average Daily Percentage Change by Weekday: 2019 On average this year, returns on Mondays were lower than every other day of the week. The weekend effect persists this year and is…
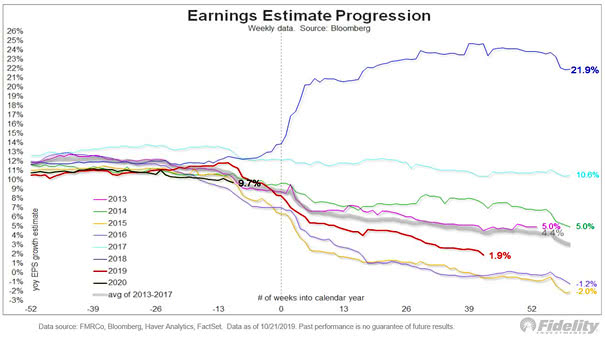
Earnings Estimate Progression This chart shows the earnings estimate progression since 2013. For this year, the consensus estimate of EPS growth is currently around 1.9%, and around 9.7% for 2020. Image: Fidelity Investments
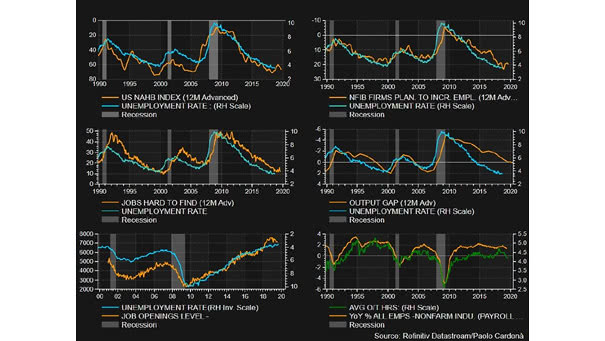
U.S. Employment Six charts suggesting that U.S. employment may weaken (correlation greater than 0.87). Image: Paolo Cardena
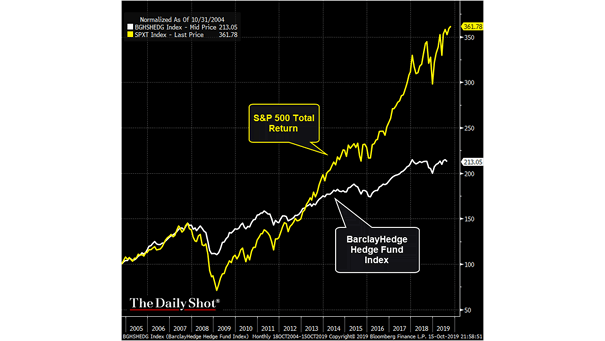
S&P 500 Total Return vs. BarclayHedge Hedge Fund Index Hedge funds have underperformed the S&P 500 over the past decade, but volatility has been lower. Image: The Daily Shot, Bloomberg
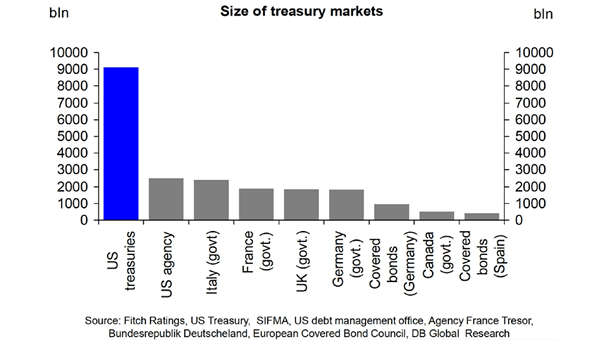
Size of Treasury Markets The U.S. Treasuries market is the largest in the world. Image: Deutsche Bank Global Research
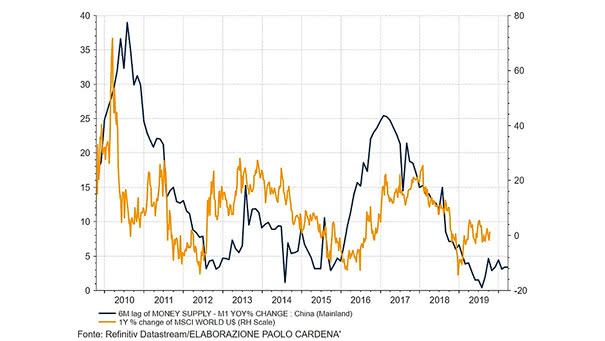
China M1 Money Supply Growth Leads MSCI World Index Chart suggesting that China M1 money supply growth leads the MSCI World Index by 6 months. Image: Paolo Cardena
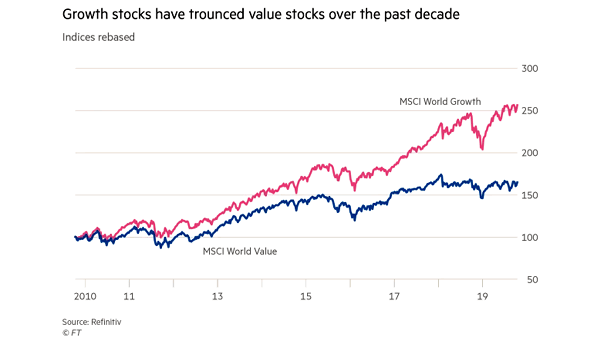
MSCI World Growth Index vs. MSCI World Value Index Over the past decade, global value stocks have remained in the shadow, while the sun has shone on global growth stocks. Image: Financial Times
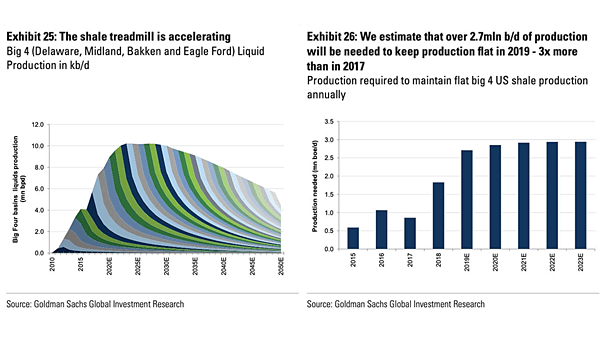
The Treadmill of U.S. Oil Shale Chart suggesting that the treadmill of U.S. shale is accelerating. Image: Goldman Sachs Global Investment Research