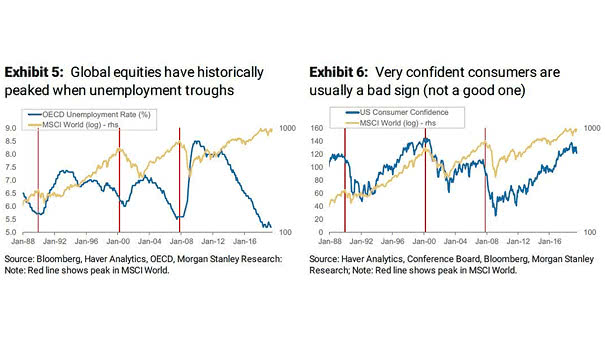
Global Consumption by Region
Global Consumption by Region Chart suggesting that developing economies will dominate global consumption. Image: McKinsey Global Institute
Copper to Gold Ratio The copper to gold ratio provides useful information on the evolution of the U.S. 10-year Treasury, the ISM Non-Manufacturing Index and the average weekly hours worked. Image: Paolo Cardena
S&P 500 Valuation and Inflation This chart suggests that the S&P 500 is fairly valued based on current inflation. Image: Truist
Most Traded Goods Between U.S. and China Taking a closer look at U.S. exports to China, and China exports to U.S., amid the trade war. Image: howmuch.net
Emerging Markets and Liquidity Cycles This chart shows that investing in emerging markets also requires an understanding of global liquidity cycles. Image: Fidelity Investments
S&P 500 Tax Adjusted EPS vs. Trend Interesting chart showing that S&P 500 tax adjusted earnings are well above the trend in the United States, and have historically preceded earning plunges. Image: J.P. Morgan Asset…
Buyback Contribution to EPS Growth Buybacks constitute a very important part of the earnings payout. Without them, there is no EPS growth. Image: Credit Suisse Research
Global Manufacturing PMI and Multi-Asset Portfolio Returns This chart suggests that markets have not taken into account this year’s growth and profits slump. Image: J.P. Morgan Asset Management
Earnings Estimates: Emerging Markets Emerging markets are the hardest hit by the trade war. Image: Fidelity Investments
Emerging Markets Growth Stocks vs. U.S. Growth Stocks This chart suggests that emerging markets growth stocks are cheapest vs. U.S. growth stocks since 2002. Image: BofA Merrill Lynch
U.S. Health Care Costs U.S. health care costs have skyrocketed and are higher than in any other country Image: Deutsche Bank Global Research