Value vs. Growth Stocks
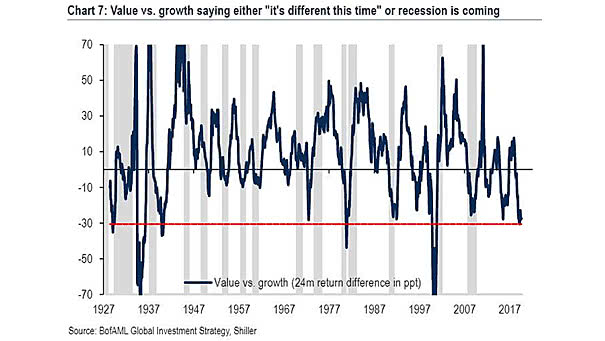
Value vs. Growth Stocks Since 1927, U.S. growth stocks have outperformed value stocks by 30% over a 2-year period, on five occasions. Each time, it was before a recession or a war. Is it different…
Value vs. Growth Stocks Since 1927, U.S. growth stocks have outperformed value stocks by 30% over a 2-year period, on five occasions. Each time, it was before a recession or a war. Is it different…
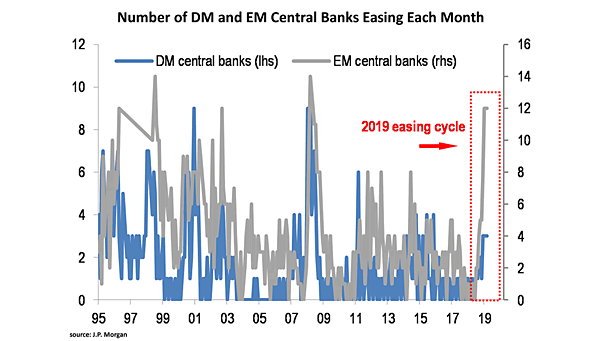
Number of DM and EM Central Banks Easing Each Month Currently, most of the world’s central banks are easing, to boost money supply in the economy and stimulate economic growth. Image: J.P. Morgan
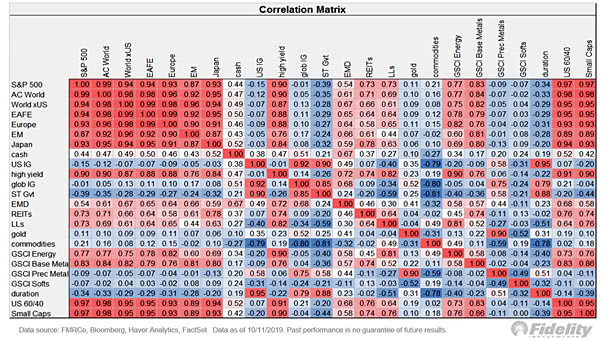
Correlation Matrix This grid shows the correlation between different asset classes. It is very useful for asset allocation. Image: Fidelity Investments
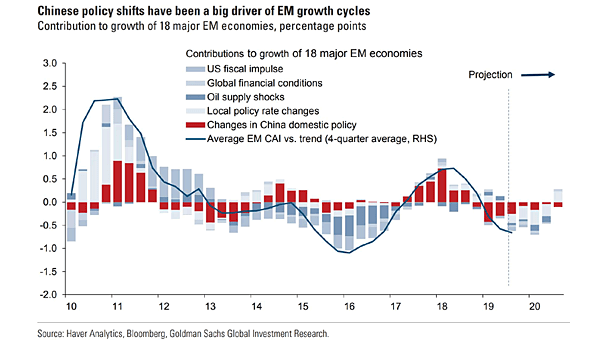
China Domestic Policy and Emerging Markets Growth Cycles Great chart suggesting that changes in China domestic policy have been a big driver of EM growth cycles. Image: Goldman Sachs Global Investment Research
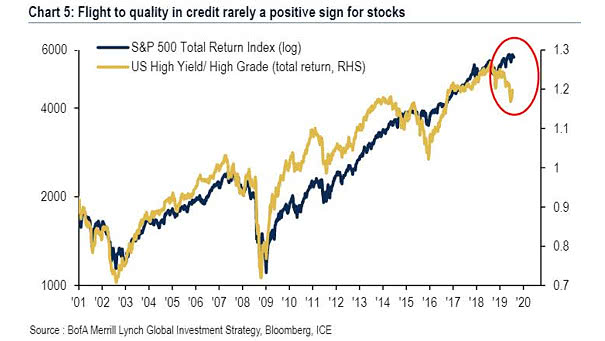
S&P 500 Total Return and U.S. High Yield/High Grade Usually, flight to quality in credit markets is rarely a good sign for equities, but ECB QE, Fed easing and repo operations should be positive. Image:…
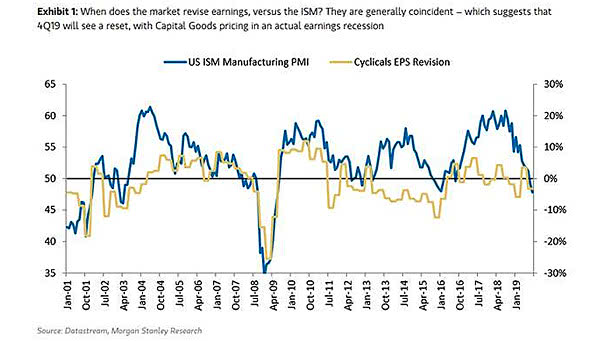
U.S. ISM Manufacturing Index and Cyclicals EPS Revision This chart shows the correlation between the ISM Manufacturing Index and cyclicals EPS revision, suggesting that 4Q19 will see a reset, with capital goods pricing in an…
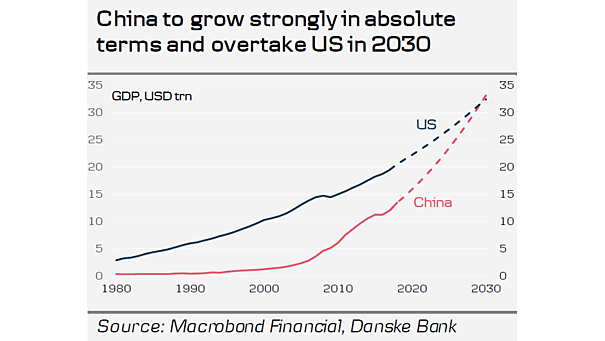
China GDP vs. U.S. GDP Chart suggesting that China GDP will overtake U.S. GDP by 2030. Image: Danske Bank Research
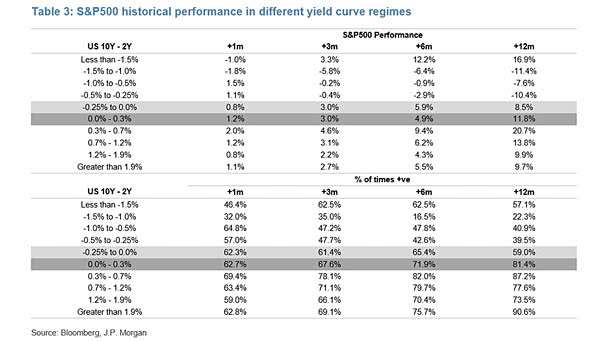
S&P 500 Historical Performance in Different Yield Curve Regimes Great table showing the U.S. 10Y-2Y Treasury spread and the S&P 500 historical performance. Image: J.P. Morgan
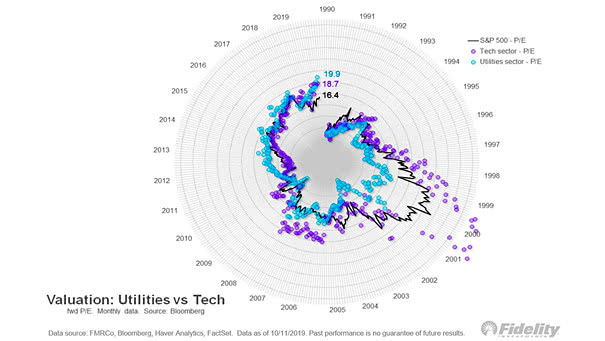
Valuation: Utilities vs. Tech vs. S&P 500 Nice chart showing the valuation of utilities vs. Tech and the S&P 500. Currently, utilities are valued at 19.9x forward EPS, tech at 18.7x, and the S&P 500…
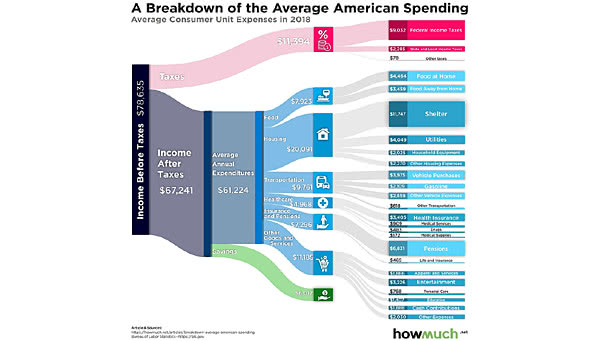
A Breakdown of the Average American Spending Consumer spending drives 68% of the U.S. economy and affects U.S. GDP. Image: howmuch.net
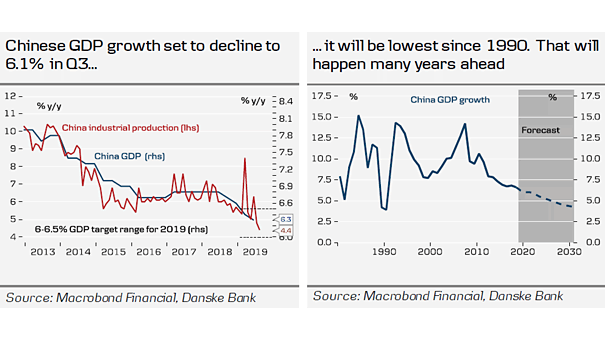
China GDP Growth China GDP growth is expected to continue to decline significantly in the coming years, with consumption becoming the main driver of growth. Image: Danske Bank Research