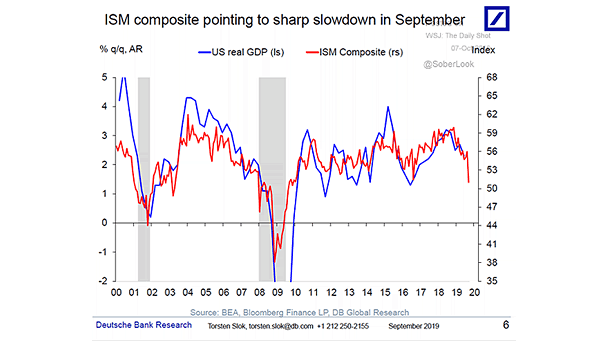
S&P 500 Total Return Change During Economic Expansions

S&P 500 Total Return Change During Economic Expansions The current business cycle is the longest and weakest expansion. The next downturn could hit the U.S. stock market much harder than the economy. Image: Irrelevant Investor…

No Deal Brexit

No Deal Brexit According to J.P. Morgan, the risk of a no-deal Brexit remains real and stands at 35%. Image: J.P. Morgan

Probability of Global Recession

Probability of Global Recession The probability of a global recession among asset managers is greater than 50%. Image: Financial Times

Central Banks Hiking/Cutting Policy Rate

Central Banks Hiking/Cutting Policy Rate A race to the bottom in global interest rates? Central Banks policy rates have started to decline again. Image: BofA Merrill Lynch Global Research

S&P 500 and Pre-Election Year

S&P 500 and Pre-Election Year In pre-election years since 1950, the chart suggests that the U.S. stock market doesn’t bottom until Thanksgiving. Image: Ryan Detrick, LPL Financial LLC

Global PMI Cycles

Global PMI Cycles Interesting table showing global PMI cycles: if investors get the global PMI right, they do well. Image: Pervalle Global

Japan – Explaining 10-Year Yields

Japan – Explaining 10-Year Yields Great chart suggesting that demographics explain Japan’s 10-year yields. An R² of 0.87 is quite high and significant. Image: Arbor Research & Trading LLC

Cass Freight Index and U.S. GDP

Cass Freight Index and U.S. GDP The Cass Freight Index suggests first signs of manufacturing activity bottoming out. Image: Macronond, SEB X-Asset Research