Is Inflation Dead? Deflation Fears Make A Comeback
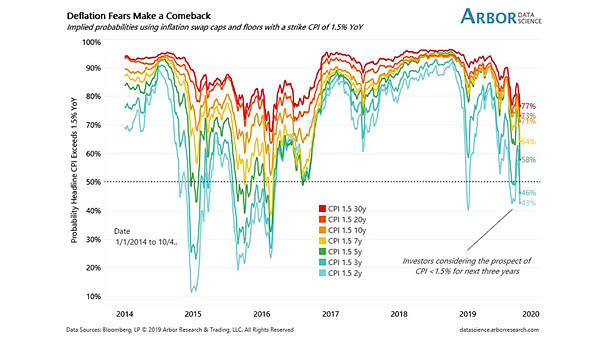
Is Inflation Dead? Deflation Fears Make A Comeback Is deflation on the horizon? Investors expect inflation running below 1.5% YoY for the next three years. Image: Arbor Research & Trading
Is Inflation Dead? Deflation Fears Make A Comeback Is deflation on the horizon? Investors expect inflation running below 1.5% YoY for the next three years. Image: Arbor Research & Trading
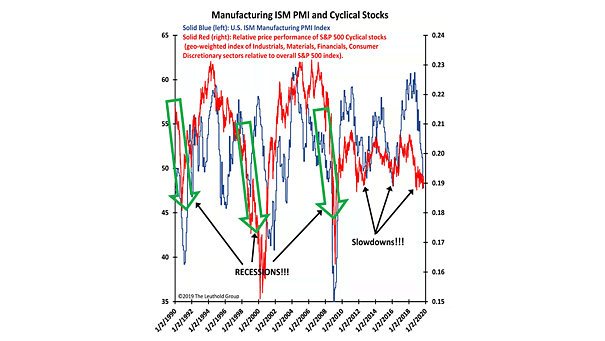
U.S. ISM Manufacturing Index and Cyclical Stocks Great chart showing that cyclical stocks suggest an economic slowdown rather than an imminent recession. Image: The Leuthold Group
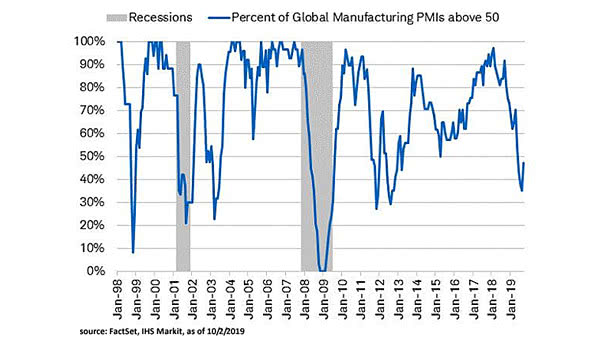
Global Manufacturing PMI Above 50 Is the worst over for global manufacturing PMI? This interesting chart shows the percentage of global manufacturing PMI above 50. Image: FactSet, IHS Markit, Charles Schwab
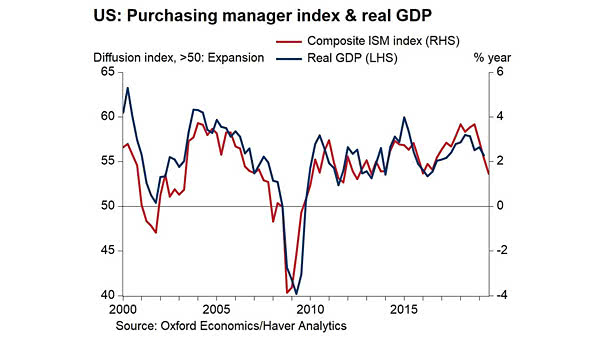
U.S. ISM PMI Composite Index and U.S. Real GDP Chart showing the correlation between the U.S. ISM PMI Composite Index and U.S. real GDP. The service sector is still expanding. Image: Oxford Economics
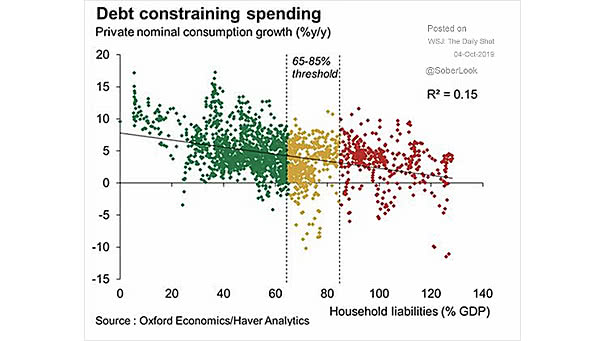
Consumption Growth and Household Debt This chart shows the effects of household debt and suggests that high household debt limits consumer spending. Image: Oxford Economics
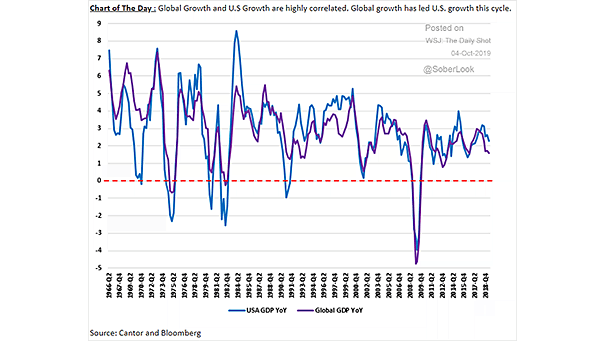
U.S. GDP vs. Global GDP The chart suggests that global growth has led U.S. growth this business cycle. And it also shows the high correlation between U.S. GDP and Global GDP. Image: Cantor Fitzgerald
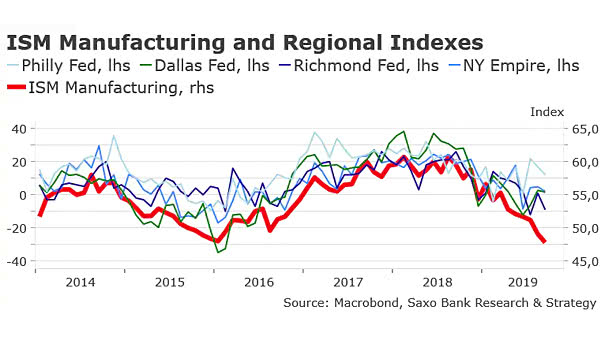
Correlation Between U.S. ISM Manufacturing Index and Regional Indexes This chart shows the quite good correlation between the U.S. ISM Manufacturing Index and regional indexes (Philly Fed, Dallas Fed, Richmond Fed, and NY Empire). Image:…
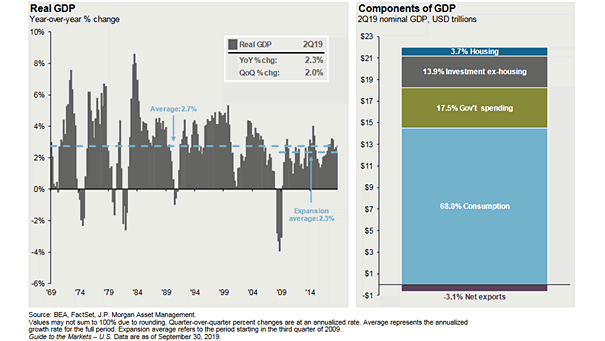
U.S. Real GDP and Components of GDP In Q2 2019, U.S. GDP was 68% personal consumption. Image: J.P. Morgan Asset Management
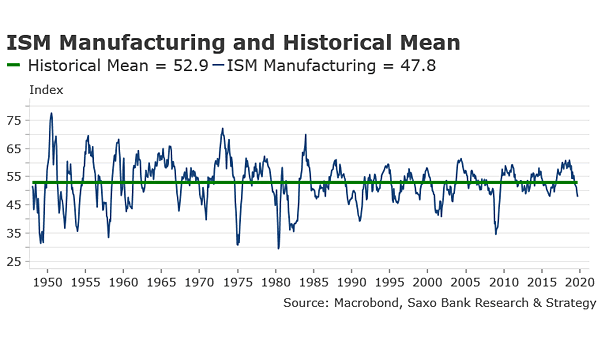
U.S. ISM Manufacturing Index and Historical Mean The historical mean of the ISM Manufacturing Index stands at 52.9. Image: Saxo Bank Research & Strategy
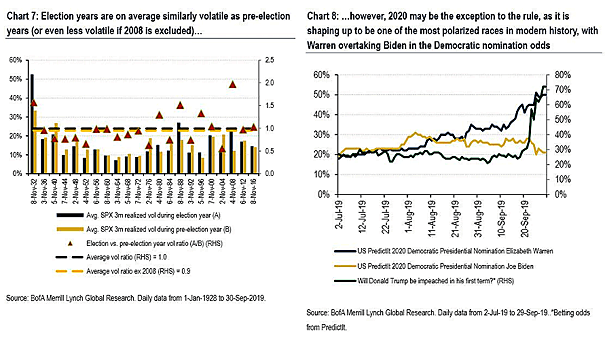
U.S. Election Years Volatility U.S. election years are on average similarly volatile, but 2020 could be different. Image: BofA Merrill Lynch
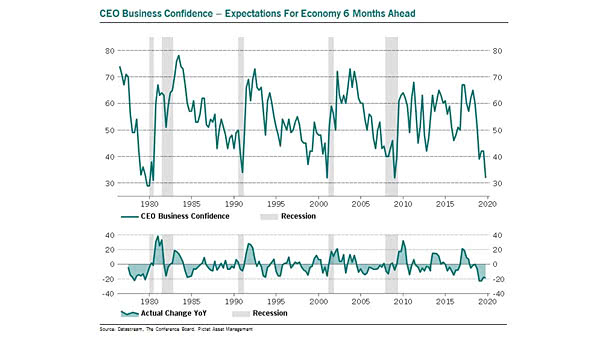
Conference Board CEO Business Confidence – Expectations for Economy 6 Months Ahead CEOs in the U.S. remain pessimistic about economic conditions. Outside of U.S. recession, CEO confidence has never been so low. Image: Pictet Asset…