The U.S. Dollar’s 15-Year Cycles
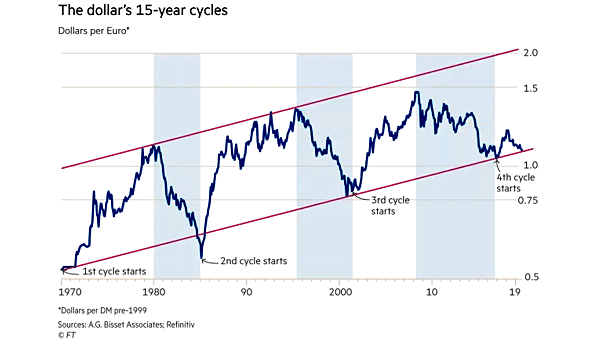
The U.S. Dollar’s 15-Year Cycles The chart suggests that the cycle in U.S. dollar from peak to peak is about 15 years on average. Image: Financial Times
The U.S. Dollar’s 15-Year Cycles The chart suggests that the cycle in U.S. dollar from peak to peak is about 15 years on average. Image: Financial Times
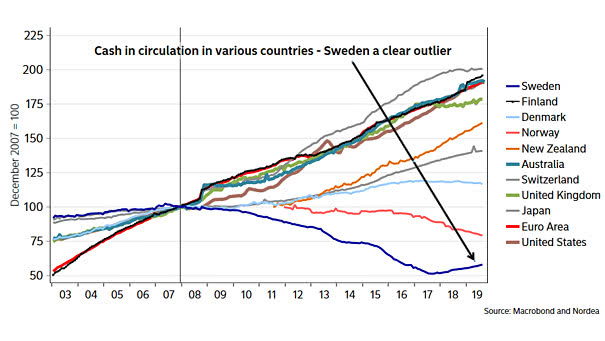
Cash in Circulation in Various Countries The use of cash has decreased significantly in Sweden. The first cashless society? Image: Nordea and Macrobond
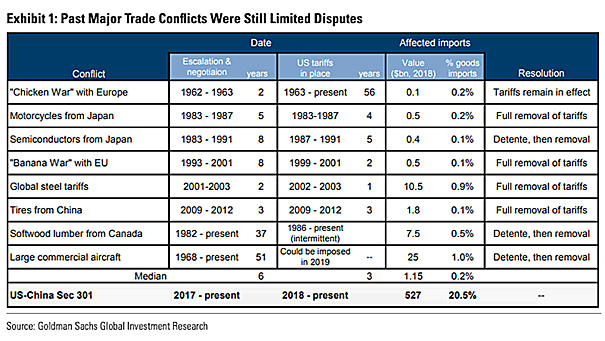
US-China Trade War and Past Major Trade Conflicts In the past, tariffs were in place for long periods of time. The US-China trade war is hitting global growth, by his importance, size and scope. Image:…
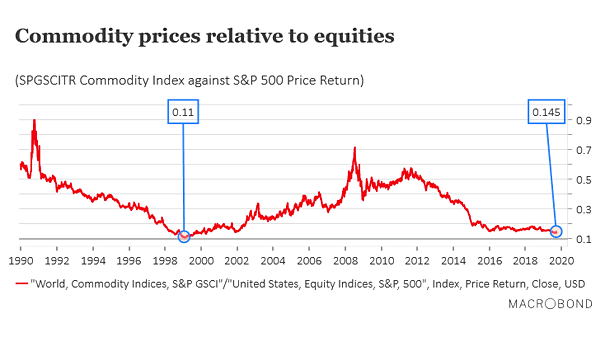
Valuation – Commodity Prices Relative to Equities Chart suggesting that commodity prices have never been more depressed relative to equities, since the late 90’s. Image: Macrobond
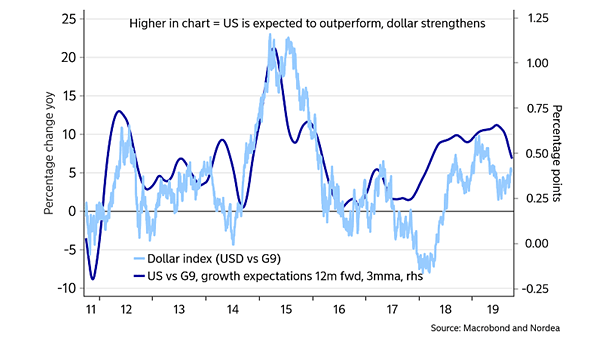
U.S. Dollar and United States vs. G9 Growth Expectations This chart suggests why the U.S. dollar is currently strong. Image: Nordea and Macrobond
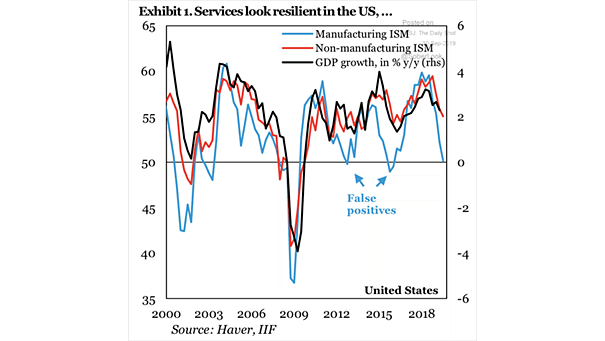
ISM Manufacturing Index, ISM Non-Manufacturing Index and U.S. GDP U.S. services sector suggests that the U.S. economy is weathering the trade war. Image: Institute of International Finance
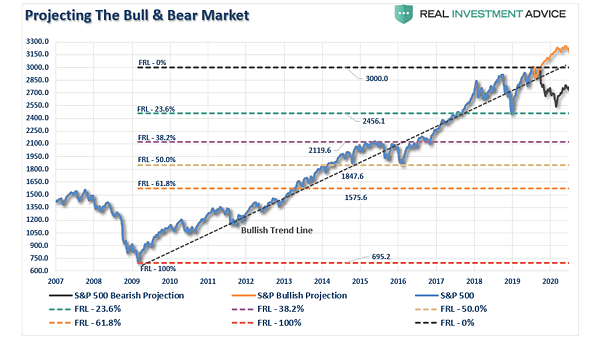
Projecting the Bull and Bear Market If a US-China trade deal is reached, this chart suggests a rally to the long-term bullish trend line at 3300. Image: Real Investment Advice
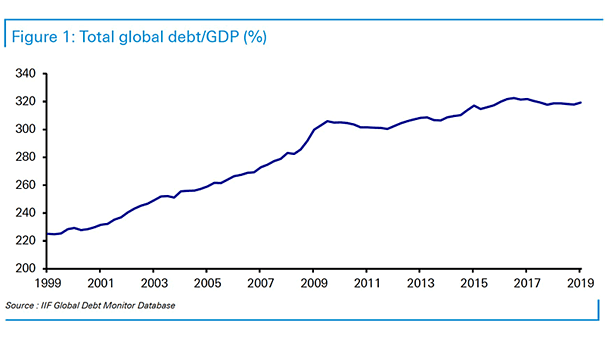
Total Global Debt to GDP The global debt-to-GDP ratio is hovering near a record at $244 trillion. That’s now more than three times the size of the world economy. Image: Deutsche Bank Global Research
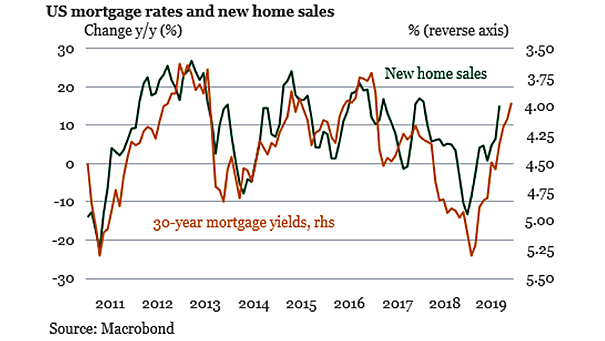
U.S. Mortgage Rates and New Home Sales The decline in mortgage rates has given a strong boost to new home sales. Image: Macrobond
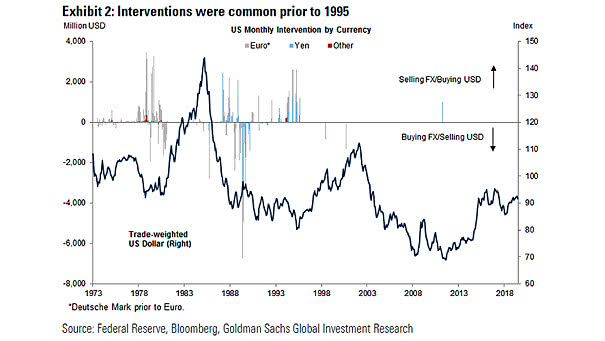
U.S. Monthly Intervention by Currency As the chart shows, frequent interventions in the foreign exchange market were fairly common prior to 1995. Image: Goldman Sachs Global Investment Research
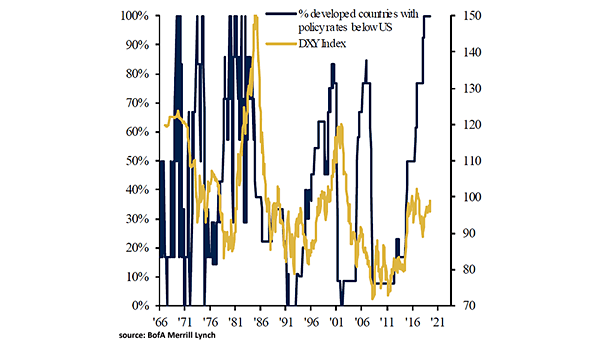
U.S. Dollar and Percentage of Developed Countries with Policy Rates below U.S. The chart suggests that the percentage of developed countries with policy rates below U.S., is a support for the U.S. dollar. Image: BofA…