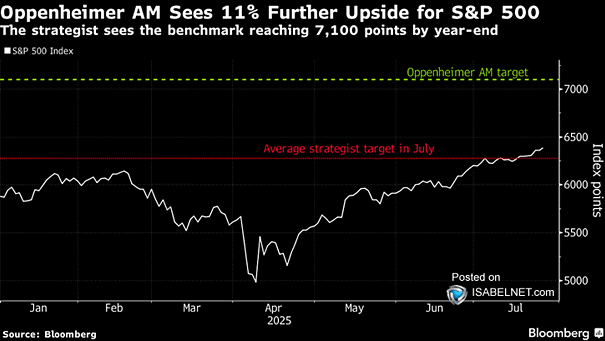
Debt-to-GDP and 10-Year Government Bond Yield

Debt-to-GDP and 10-Year Government Bond Yield While it might seem intuitive that higher debt burdens would lead to higher yields due to increased risk, this relationship has not held true in practice. Yields are influenced…

Magnificent Seven Stocks vs. Unprofitable Tech

Magnificent Seven Stocks vs. Unprofitable Tech The Magnificent 7’s market dominance may be waning, at least in the short-term, as unprofitable tech stocks have recently outperformed these tech giants, indicating a broader market expansion. Image:…

S&P 500 vs. Margin Debt

S&P 500 vs. Margin Debt Margin debt boosts market gains as investors leverage their positions to increase buying power. A reliable warning sign for reducing portfolio risk occurs when margin balances drop below the 12-month…

ISABELNET Cartoon of the Day

ISABELNET Cartoon of the Day For bears, the bull market is a recurring nightmare they can’t wake up from. For bulls, it’s just another day of ignoring risk and having a great time! Happy “Hump”…

YTD Equity Return vs. U.S.

YTD Equity Return vs. U.S. In 2025, the relative outperformance of international stocks compared to U.S. equities has underscored the benefits of diversification for investors so far. Image: Goldman Sachs Global Investment Research

Median Stock Short Interest as Share of Market Capitalization

Median Stock Short Interest as Share of Market Capitalization While the S&P 500’s median short interest is currently low by historical standards, Consumer Staples, Utilities, and Health Care sectors are notable exceptions, showing elevated short…

Hedge Fund and Mutual Fund Equity Exposure

Hedge Fund and Mutual Fund Equity Exposure In a sign of optimism about the current economic climate, hedge funds and mutual funds have collectively increased their stakes in U.S. equities, which paints a picture of…

Citi Economic Surprise Index

Citi Economic Surprise Index The falling Citi U.S. Economic Surprise Index indicates that economic data is no longer surpassing expectations, but this doesn’t necessarily signal a sudden economic downturn. Image: Bloomberg

Annual Change in Gold Demand

Annual Change in Gold Demand Central banks’ gold demand has grown by 11.5% annually since 2019, fueling the current price rally as they aim to diversify reserves. While gold excels as a crisis hedge, it…

S&P 500 Bull Markets

S&P 500 Bull Markets The current bull market, which began in October 2022, is showing potential for continued growth at 28 months old. Historically, bull markets have lasted an average of 5.5 years since 1949,…