Inequality – Concentration of Stock Ownership by Wealth Class in the U.S.
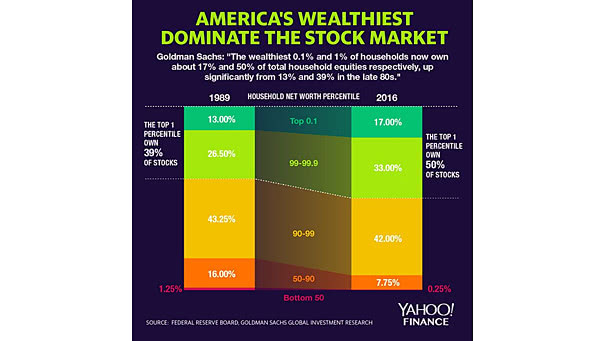
Inequality – Concentration of Stock Ownership by Wealth Class in the U.S. The top 1% own 50% of stocks held by American households. Image: Yahoo! Finance
Inequality – Concentration of Stock Ownership by Wealth Class in the U.S. The top 1% own 50% of stocks held by American households. Image: Yahoo! Finance
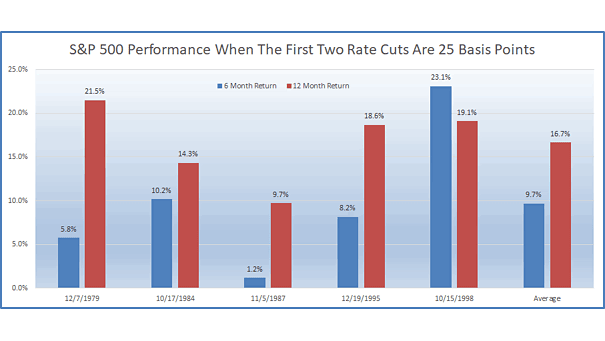
S&P 500 Performance When the First Two Rate Cuts Are 25 Basis Points Over 40 years, the S&P 500 returns over 6 and 12 months were all positive when the first two rate cuts were…
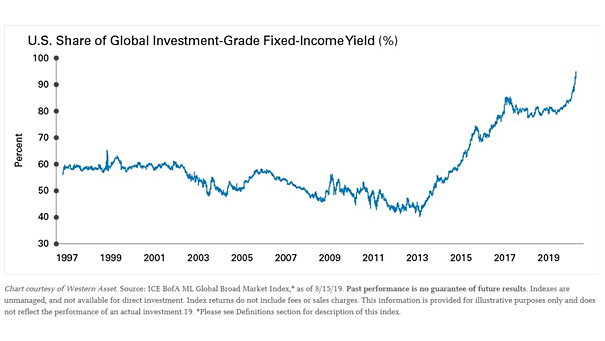
U.S. Share of Global Investment-Grade Fixed-Income Yield With negative yields in Europe and Japan, the U.S. now accounts for 95% of the positive investment-grade yield. Image: Legg Mason
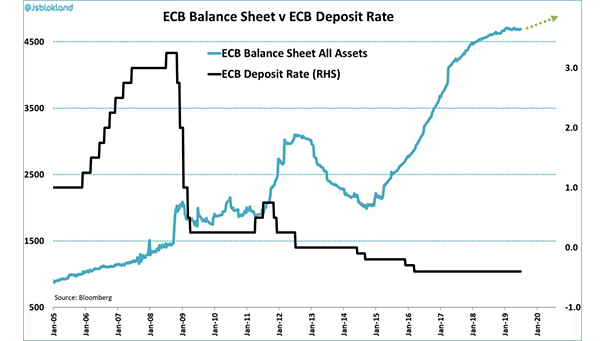
ECB Balance Sheet vs. ECB Deposit Rate It could be difficult to push rates further into negative territory without affecting the profitability and financing capacity of Eurozone banks. Image: Jeroen Blokland
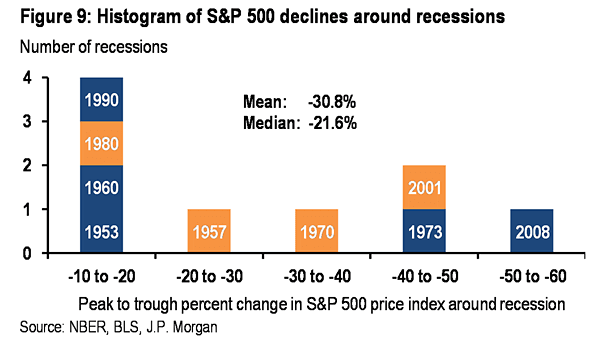
Histogram of S&P 500 Declines Around Recessions Chart showing peak-to-trough percent change in the S&P 500 index around recessions (median: -21.6%). Image: J.P. Morgan
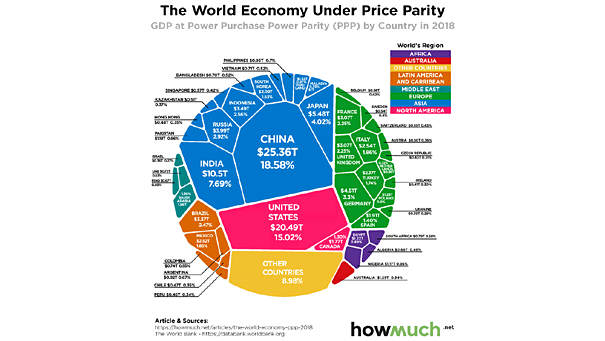
The World Economy – GDP at Power Purchase Power Parity by Country This map shows the changes in the world GDP when adjusted by the cost of living. You may also like “The World Economy…
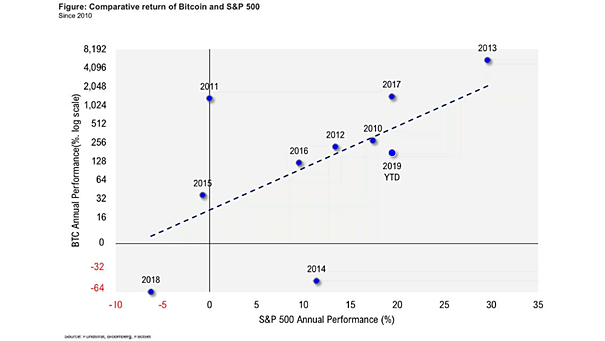
Comparative Return of Bitcoin and S&P 500 This chart suggests that the best years for Bitcoin are when the S&P 500 is above 15%. Image: Fundstrat Global Advisors, LLC
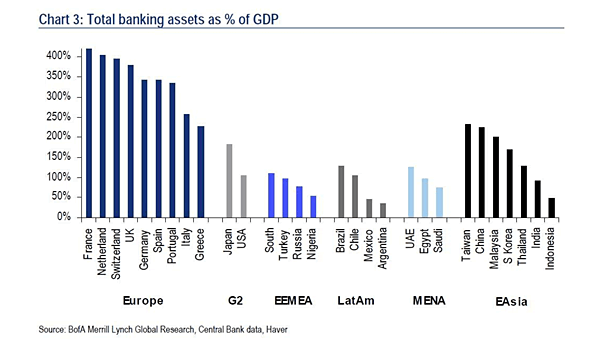
Total Banking Asset as Percentage of GDP Negative interest rates have a big impact on the profitability of banks and screw up the economy. Image: BofA Merrill Lynch Global Research
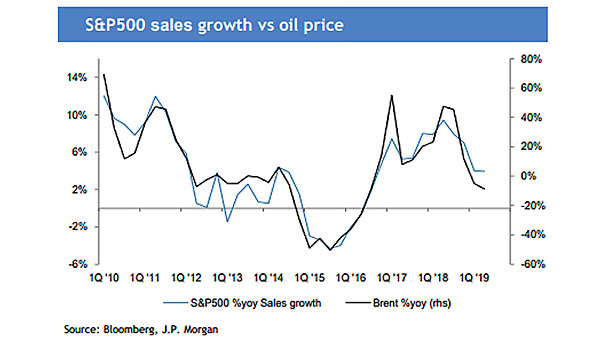
S&P 500 Sales Growth vs. Oil Price This chart shows the good correlation between S&P 500 sales growth and the price of oil. Image: J.P. Morgan
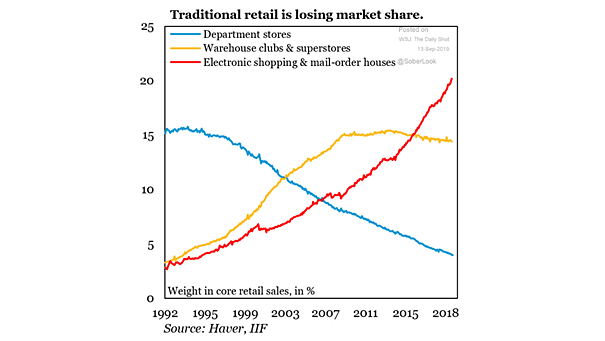
U.S. Retail Market Share by Category This chart shows how quickly online shopping is eating the traditional retail world. Image: Institute of International Finance
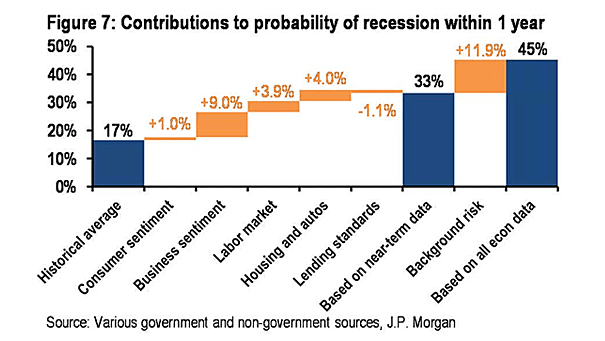
Contributions to Probability of U.S. Recession within One Year Chart suggesting that the probability of a recession in the United States within a year is 45%. Image: J.P. Morgan