U.S. and European Buybacks
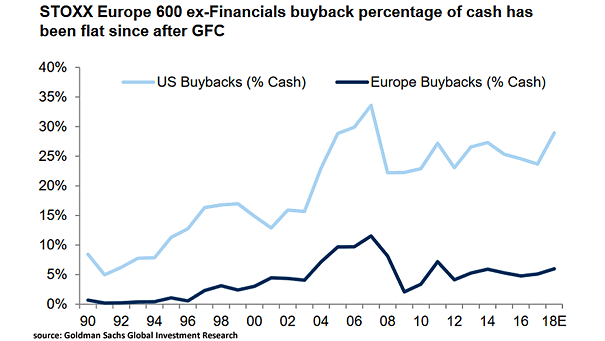
U.S. and European Buybacks U.S. and European buybacks as percentage of cash are not at their pre-global financial crisis levels. Image: Goldman Sachs Global Investment Research
U.S. and European Buybacks U.S. and European buybacks as percentage of cash are not at their pre-global financial crisis levels. Image: Goldman Sachs Global Investment Research
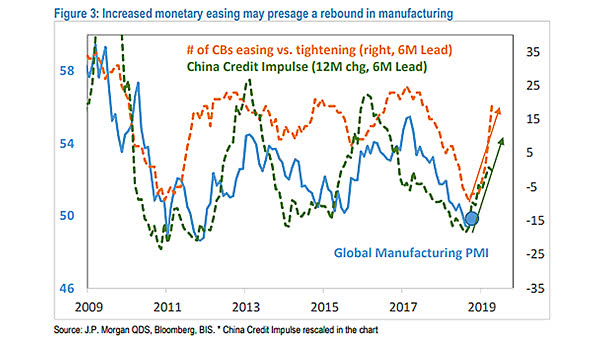
China Credit Impulse and Number of Central Banks Easing vs. Tightening Lead Global Manufacturing PMI This chart suggests that China credit impulse and the number of central banks easing vs. tightening lead global manufacturing PMI…
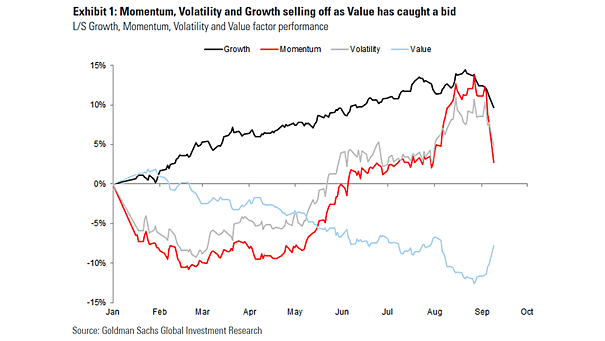
Growth, Momentum, Volatility and Value Factor Performance Chart showing that value stocks make a comeback as momentum and growth stocks get hammered. Image: Goldman Sachs Global Investment Research
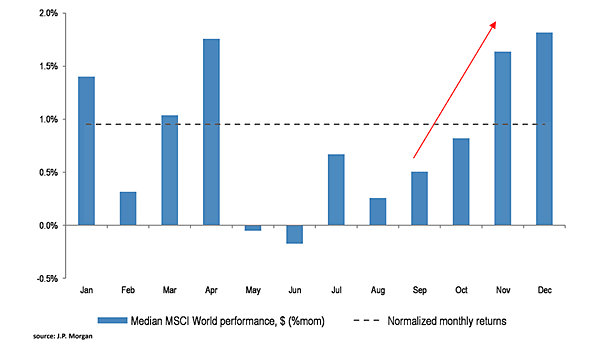
Median MSCI World Index vs. Its Seasonal Pattern This chart shows when the median MSCI World Index tends to perform better or worse at certain times of the year. Image: J.P. Morgan
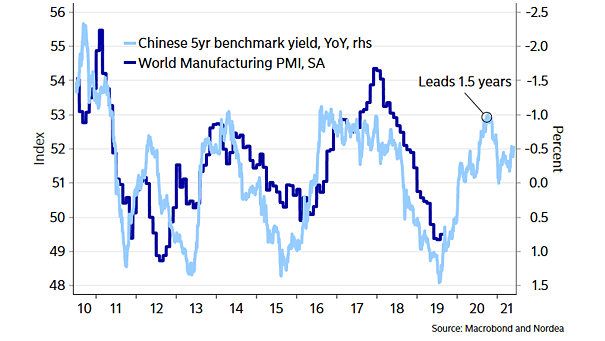
Chinese 5-Year Benchmark Yield Leads Global Manufacturing PMI Great chart suggesting that the Chinese 5-year benchmark yield leads global manufacturing PMI by 18 months. Image: Nordea and Macrobond
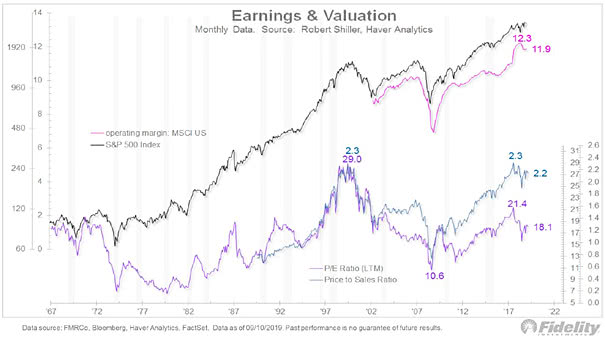
U.S. Stock Market – Earnings and Valuation The valuation is high relative to history, but not near historical extremes. The U.S. stock market should remain under pressure until Q3 earnings season. Image: Fidelity Investments
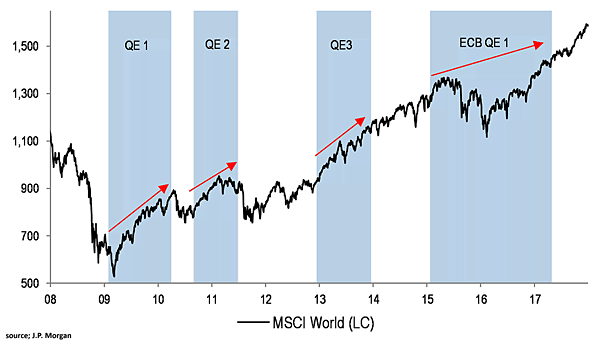
Equity Markets and QE Chart suggesting that equity markets tend to move higher during QE periods. Image: J.P. Morgan
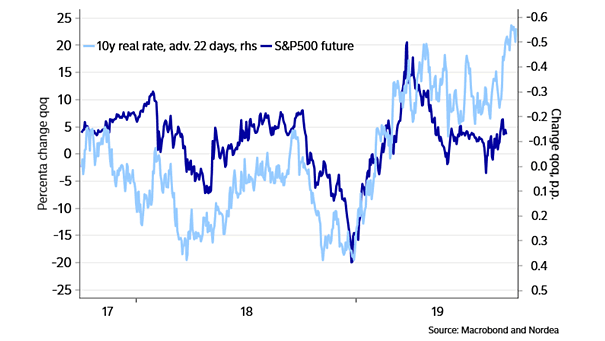
U.S. 10-Year Real Rate Leads S&P 500 Future Chart suggesting that the U.S. 10-year real rate leads the S&P 500 future by 22 days. Image: Nordea and Macrobond
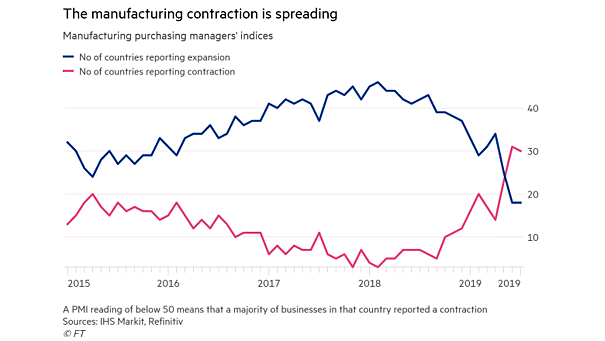
Global Manufacturing Activity The number of countries in contraction is higher than the number of countries in expansion. Image: Financial Times
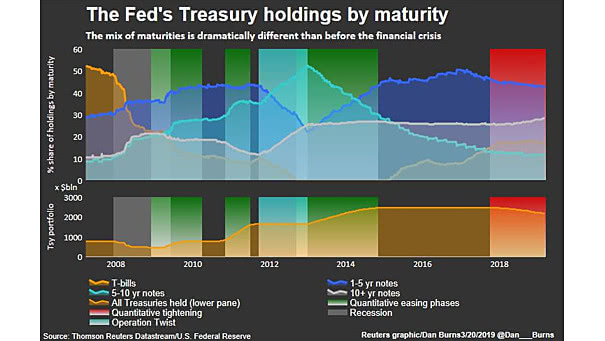
The Fed’s Treasury Holdings by Maturity Nice chart showing the Fed’s Treasury holdings by maturity before and after the financial crisis. Image: Reuters
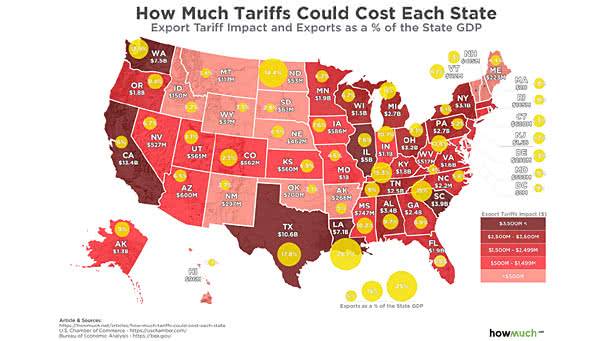
How Much Tariffs Could Cost Each State? This chart shows how much each state would be affected by China’s export tariffs. Image: howmuch.net