Total Banking Asset as Percentage of GDP
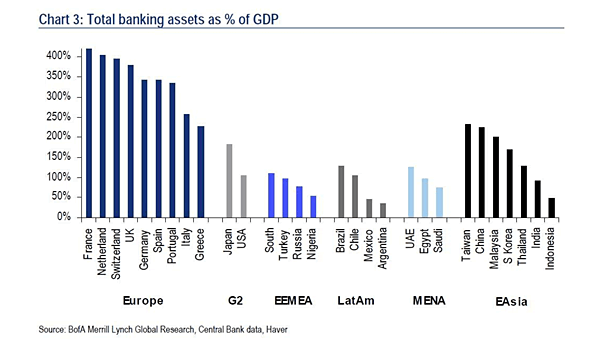
Total Banking Asset as Percentage of GDP Negative interest rates have a big impact on the profitability of banks and screw up the economy. Image: BofA Merrill Lynch Global Research
Total Banking Asset as Percentage of GDP Negative interest rates have a big impact on the profitability of banks and screw up the economy. Image: BofA Merrill Lynch Global Research
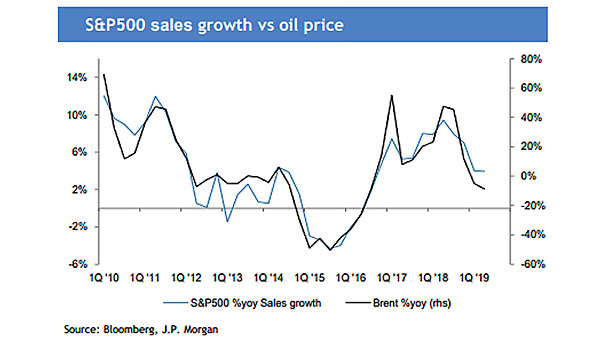
S&P 500 Sales Growth vs. Oil Price This chart shows the good correlation between S&P 500 sales growth and the price of oil. Image: J.P. Morgan
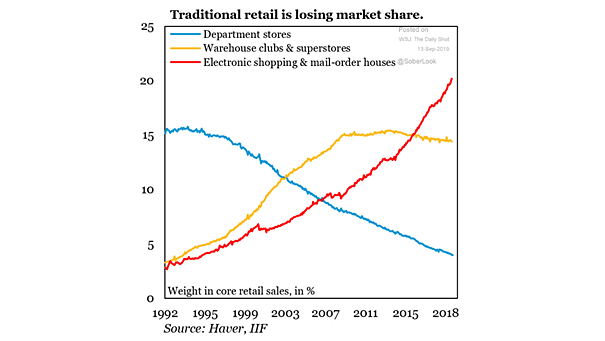
U.S. Retail Market Share by Category This chart shows how quickly online shopping is eating the traditional retail world. Image: Institute of International Finance
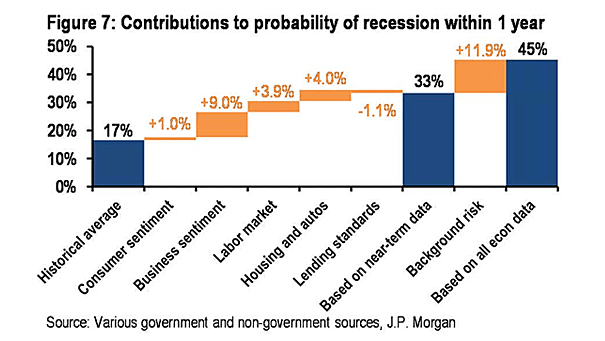
Contributions to Probability of U.S. Recession within One Year Chart suggesting that the probability of a recession in the United States within a year is 45%. Image: J.P. Morgan
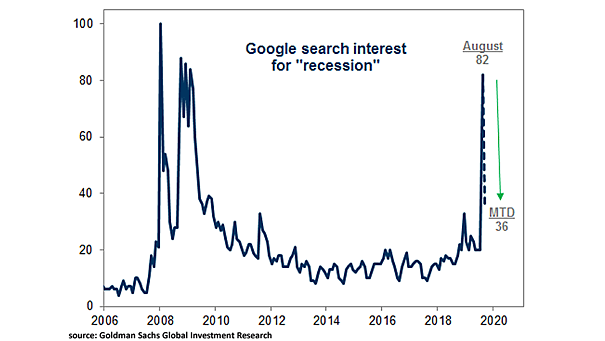
Search Interest for “Recession” Google search interest for “Recession” has declined. Is the fear gone? Image: Goldman Sachs Global Investment Research
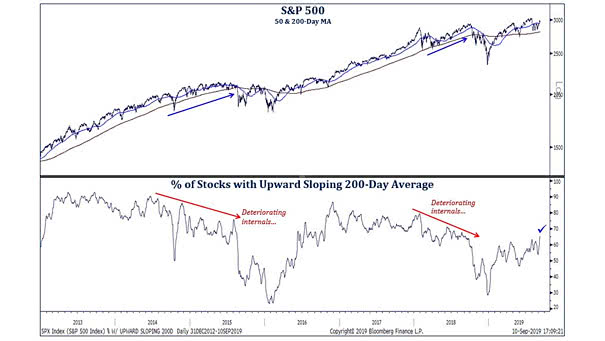
S&P 500 – Percentage of Stocks with Upward Sloping 200-Day Average This chart suggests that the U.S. stock market’s internal trend is improving. Image: Strategas
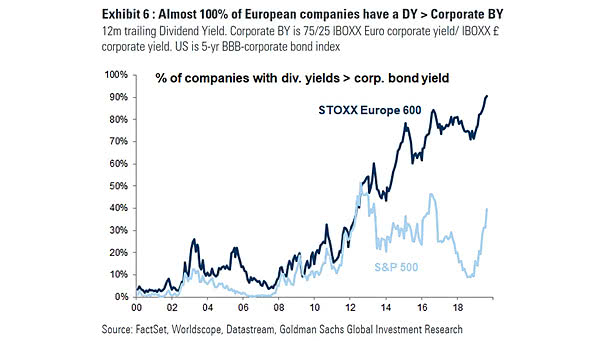
Dividend Yield vs. Corporate Bond Yield This chart shows that dividend yields of European companies appear more attractive than corporate bond yields. Image: Goldman Sachs Global Investment Research
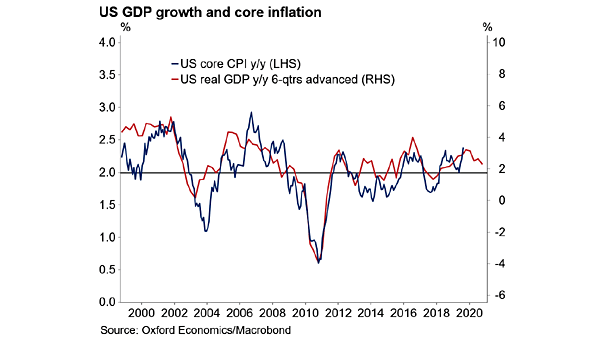
U.S. Real GDP Growth Leads Core Inflation This great chart suggests that U.S. real GDP growth leads core inflation by 18 months. Image: Oxford Economics, Macrobond
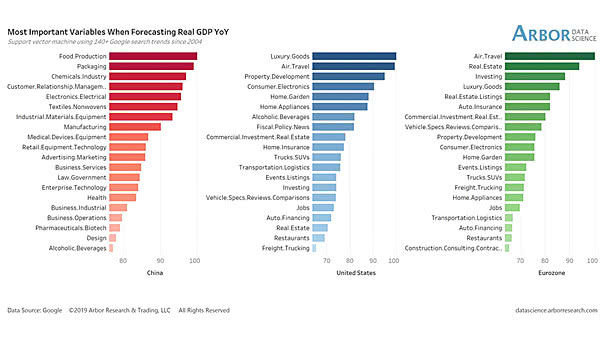
Most Important Variables When Forecasting Real GDP Search trends are very different between China (manufacturing industry) and the USA/Eurozone (consumer), when forecasting real GDP. Image: Arbor Research & Trading LLC
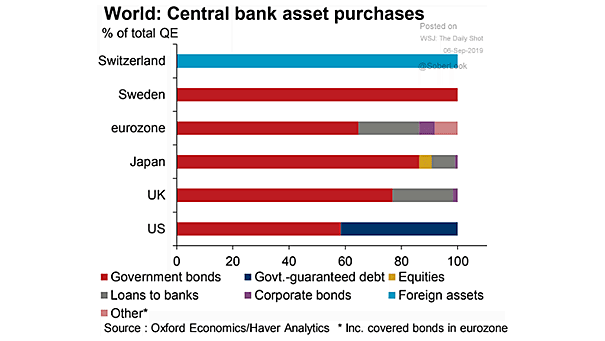
World – Central Bank Asset Purchases Great chart showing central bank asset purchases. Image: Oxford Economics
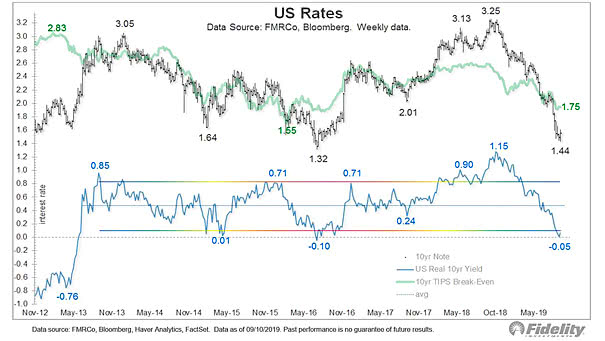
U.S. Rates Chart showing the dramatic plunge in interest rates over the past 10 months. On the positive side, the equity risk premium (ERP) is now higher. Image: Fidelity Investments