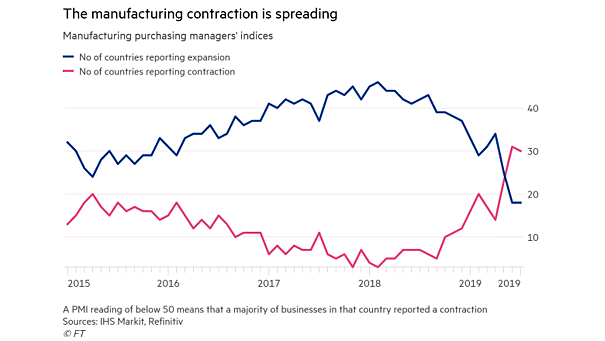
Global Manufacturing Activity
Global Manufacturing Activity The number of countries in contraction is higher than the number of countries in expansion. Image: Financial Times
Global Manufacturing Activity The number of countries in contraction is higher than the number of countries in expansion. Image: Financial Times
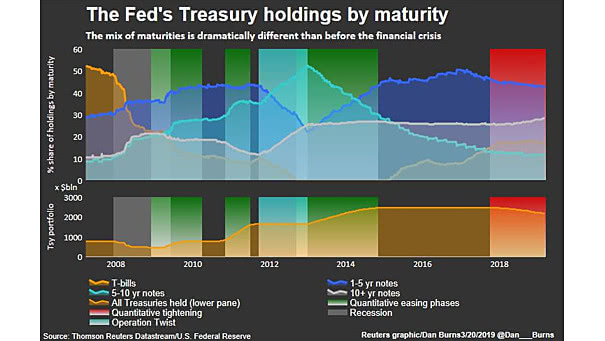
The Fed’s Treasury Holdings by Maturity Nice chart showing the Fed’s Treasury holdings by maturity before and after the financial crisis. Image: Reuters
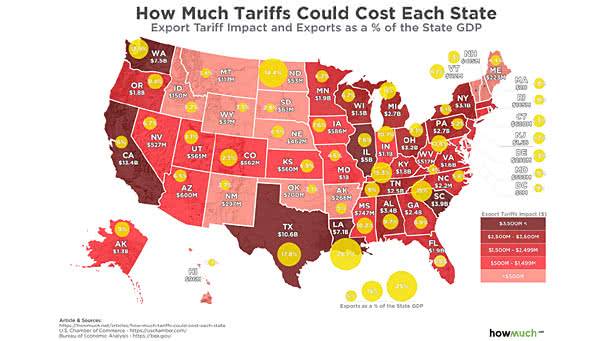
How Much Tariffs Could Cost Each State? This chart shows how much each state would be affected by China’s export tariffs. Image: howmuch.net
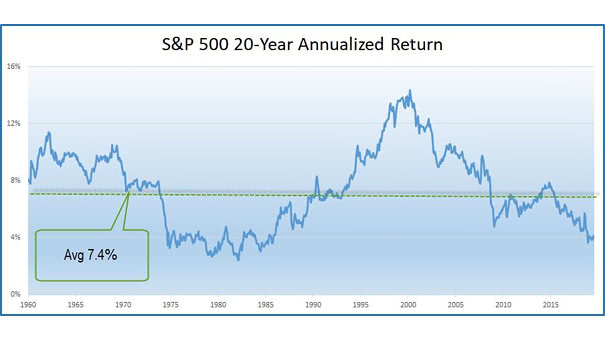
S&P 500 20-Year Annualized Return This chart puts the last two decades into perspective (average 7.4% annualized return since 1960). Image: Ryan Detrick, LPL Financial LLC
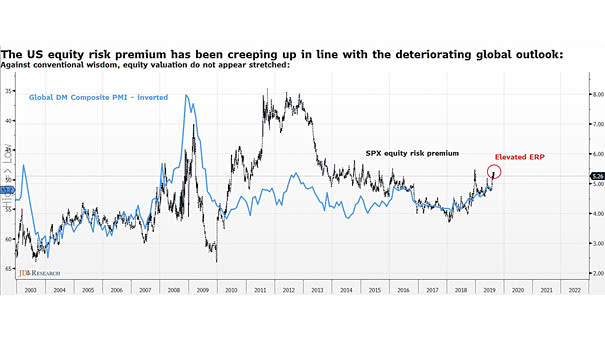
S&P 500 Equity Risk Premium and Global DM Composite PMI Nice chart showing that the equity risk premium of the S&P 500 is currently elevated. Image: JDI research
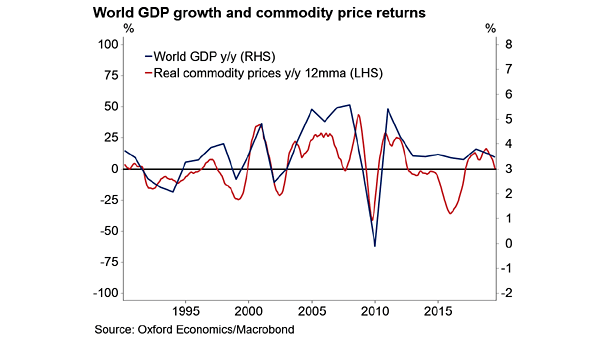
World GDP and Real Commodity Price Returns Interesting chart showing the correlation between world GDP and real commodity price returns. Image: Oxford Economics, Macrobond
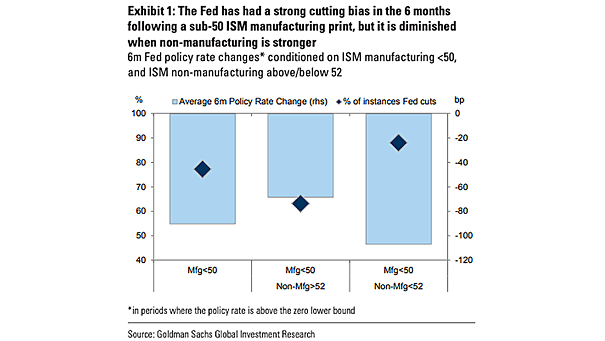
Fed Rate Cut vs. ISM Manufacturing Index and ISM Non-Manufacturing Index Since 1997, when the ISM Manufacturing Index is below 50 and the ISM Non-Manufacturing Index is above 52, the Fed is less aggressive, with…
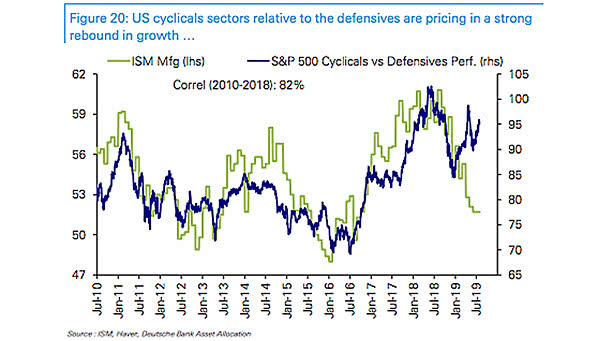
U.S. ISM Manufacturing Index and S&P 500 Cyclicals vs. Defensives Chart showing that U.S. cyclicals sectors relative to defensive sectors are still pricing in a strong rebound in growth (R = 0.82). Image: Deutsche Bank…
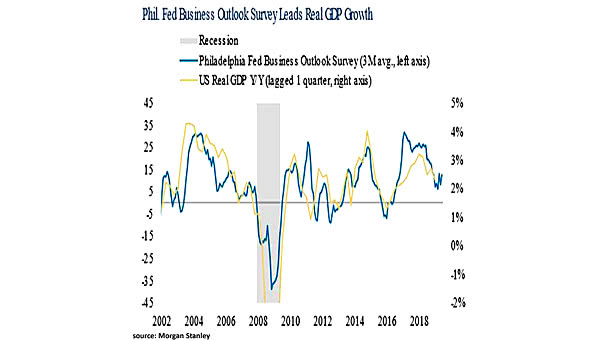
Philly Fed Business Outlook Survey Leads Real U.S. GDP Growth Chart suggesting that the Philly Fed Business Outlook Survey leads real U.S. GDP growth by 3 months. Image: Morgan Stanley Research
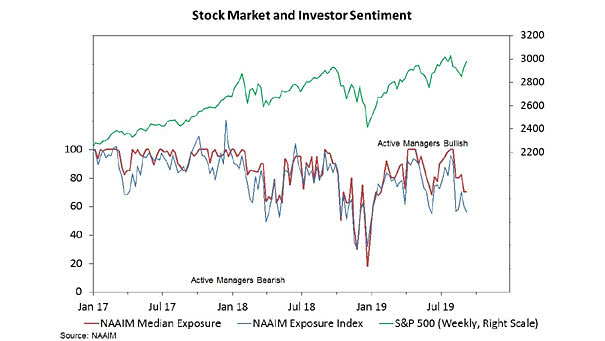
Investor Sentiment – NAAIM Exposure Index and S&P 500 NAAIM Exposure Index dropped to 56.15% (median exposure at 70%). NAAIM members’ optimism was short-lived. Image: Willie Delwiche, Baird
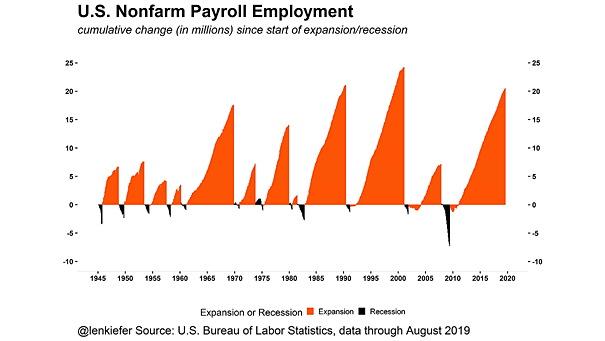
U.S. Nonfarm Payroll Employment During this business cycle, America has added over 20 million jobs. Image: Leonard Kiefer