VIX and MOVE Correlation
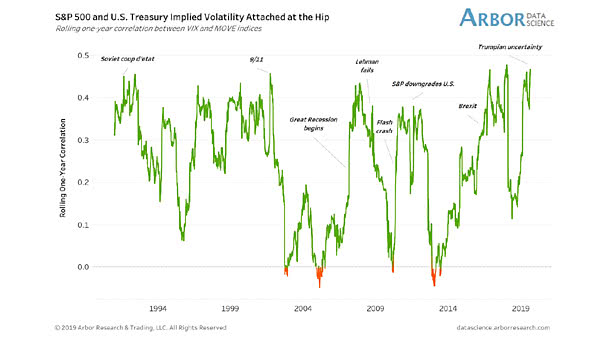
VIX and MOVE Correlation Periods of high correlation between VIX and MOVE are not good for balanced portfolios, because diversification is hard to find. Image: Arbor Research & Trading LLC
VIX and MOVE Correlation Periods of high correlation between VIX and MOVE are not good for balanced portfolios, because diversification is hard to find. Image: Arbor Research & Trading LLC
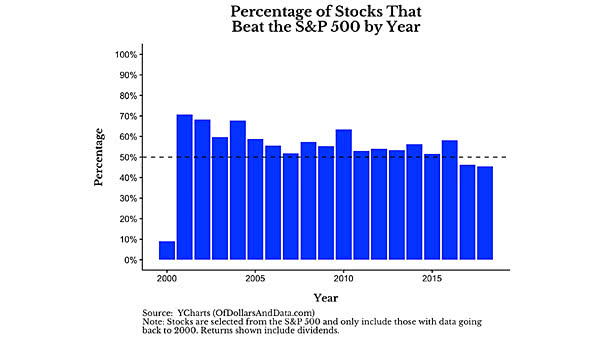
Percentage of Stocks That Beat the S&P 500 by Year This chart shows that the percentage of U.S. stocks that beat the S&P 500 in a given year is not small, but stock picking is…
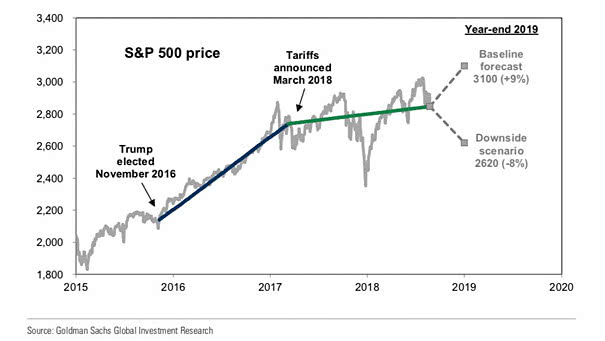
S&P 500 Forecast for 2019 Goldman Sachs is holding its year-end price-target for the S&P 500 at 3100, and its downside scenario at 2620 (as of August 23, 2019). Image: Goldman Sachs Global Investment Research
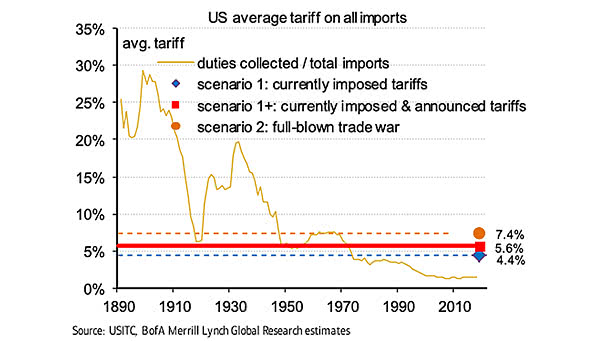
U.S. Average Tariff on All Imports A look at U.S. tariffs in the past and where they are today. Average U.S. tariffs were close to 1%, until President Trump decided to raise them. Image: BofA…
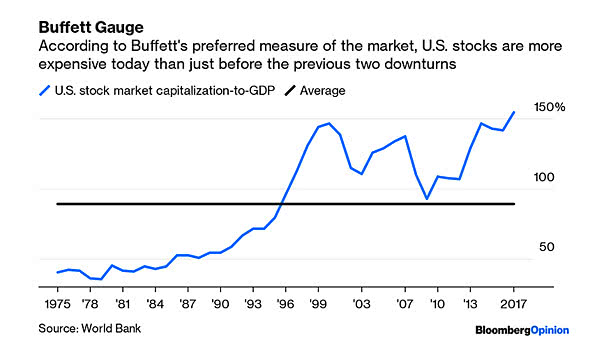
Valuation – U.S. Stock Market Capitalization-to-GDP The U.S. stock market capitalization-to-GDP is a general gauge of market valuation, but it’s not very useful for short-term market timing. Image: Bloomberg
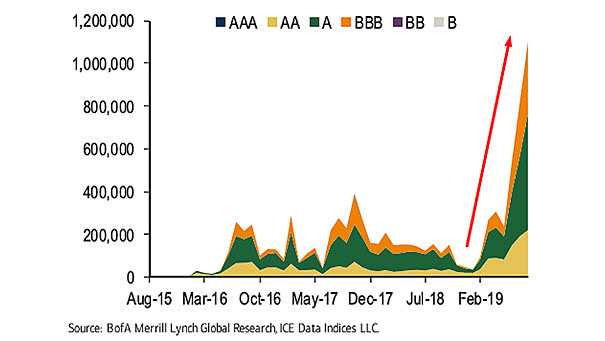
Negative Yielding European Corporate Bonds Now, €1.1 trillion of European corporate bonds yield are below zero: exactly half of the European high-grade credit market. Image: BofA Merrill Lynch
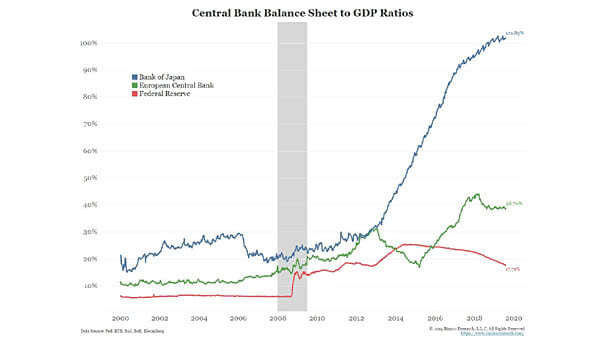
Central Bank Balance Sheet to GDP Ratios Central bank balance sheet to GDP ratios, influenced by monetary policy, vary from one economy to another. Image: Bianco Research
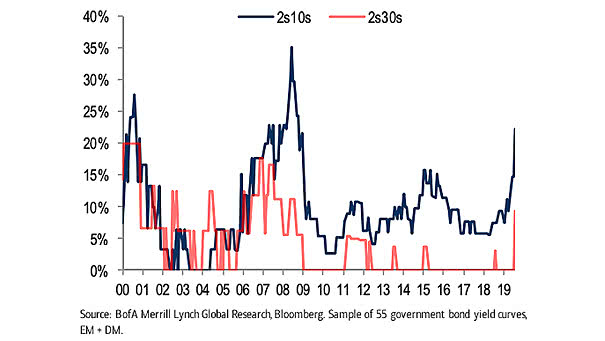
Percentage of Inverted Yield Curves Across the Globe Now, nearly 25% of global 2s10s yield curves and nearly 10% of global 2s30s yield curves are inverted. Image: BofA Merrill Lynch
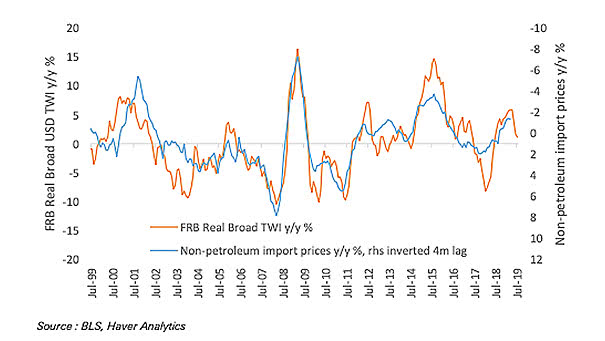
Strong Dollar and Imports The chart shows that a stronger dollar depresses goods prices via imports. Image: Deutsche Bank Global Research
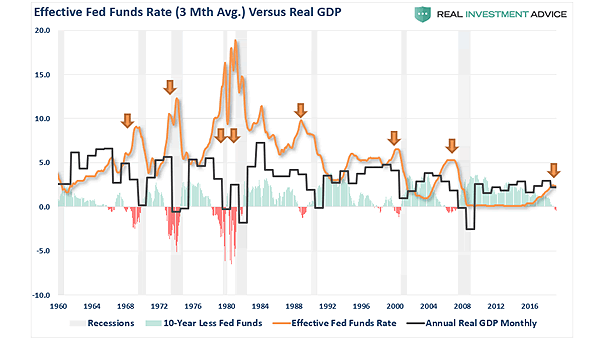
One of the Best Recession Indicator The Fed is cutting rates and the 10-year rate is inverted to Fed funds. Image: Real Investment Advice
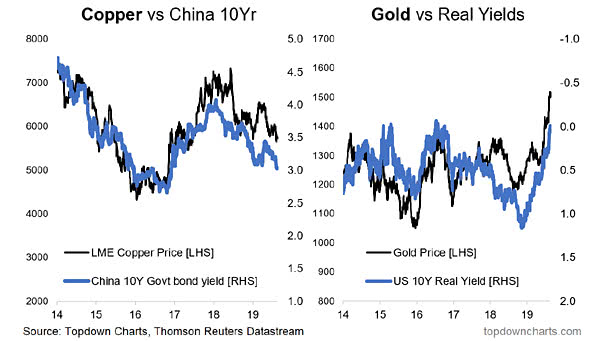
Copper vs. China and Gold vs. U.S. Real Yields Copper price is underperfoming gold, because China 10-year yields and U.S. real yields are falling. Image: Topdown Charts