S&P 500 – Share of Sales Derived from Outside United States
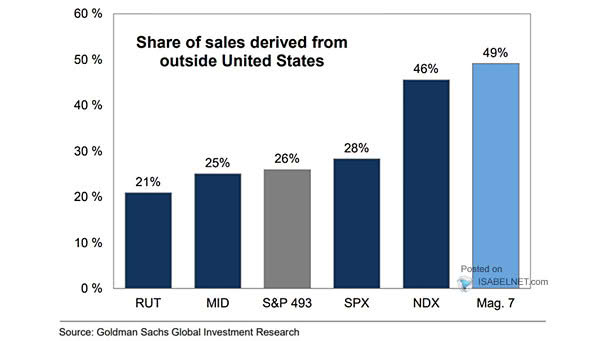
S&P 500 – Share of Sales Derived from Outside United States The “Magnificent Seven” tech giants are more exposed to global trade risks than the rest of the S&P 500, as 49% of their revenue…
S&P 500 – Share of Sales Derived from Outside United States The “Magnificent Seven” tech giants are more exposed to global trade risks than the rest of the S&P 500, as 49% of their revenue…
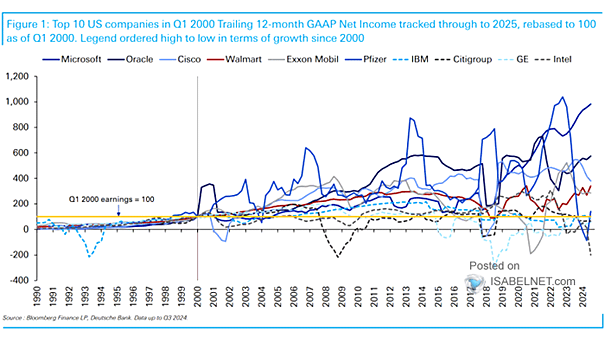
S&P 500 – Cumulative Total % Return of the Top 10 U.S. Companies Since 2000, maintaining dominance and consistently beating the S&P 500 has eluded almost all top-ten stocks except for rare cases like Microsoft.…
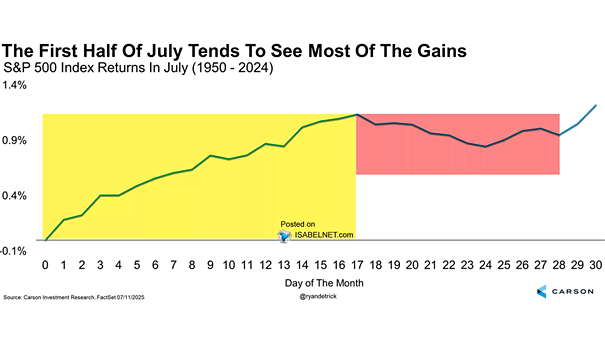
S&P 500 Index Returns in July Historically, the U.S. stock market tends to peak around this time in July. Given both seasonal and technical patterns, it would be perfectly normal for the current powerful 26%…
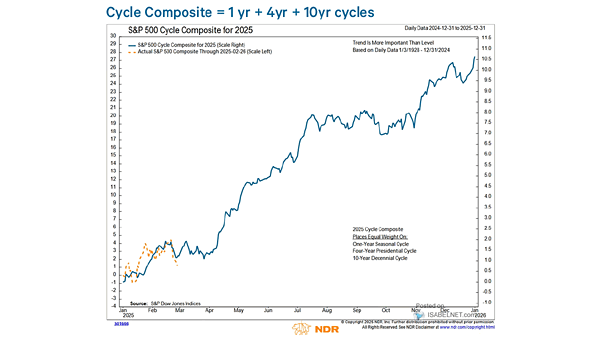
S&P 500 Cycle Composite The S&P 500 Cycle Composite points to a less bullish period of the year, with 2025 so far following typical seasonal patterns: early strength, mid-year volatility, and a potential year-end rally.…
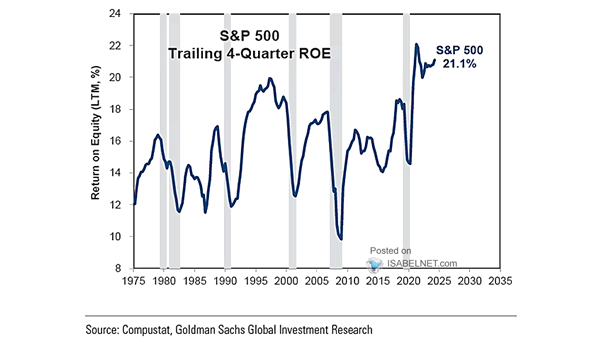
Return on Equity (ROE) : S&P 500 vs. MSCI World ex. U.S. U.S. stocks have significantly outperformed their global peers in recent years, driven by the superior return-on-equity of American companies—a key factor reinforcing the…
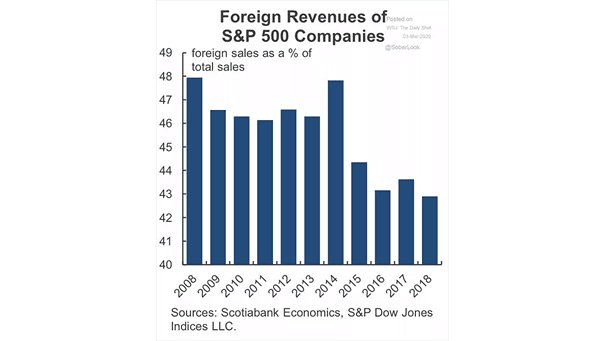
Foreign Revenues of S&P 500 Companies While S&P 500 companies are broadly exposed to global markets, the majority of their sales—and thus, much of their operational and macroeconomic risk—remains tied to the U.S. economy. Image:…
Share of Tariff Cost Burden While the importer of record pays the tariff legally, the economic cost of tariffs is distributed across U.S. consumers, U.S. businesses that rely on imports, and foreign exporters. Image: Goldman…
International vs. Domestic Exposure Export-oriented U.S. stocks surged after the tariff pause announcement, reflecting growing investor optimism over easing trade tensions—though potential tariff policy changes remain key factors to watch. Image: Bloomberg
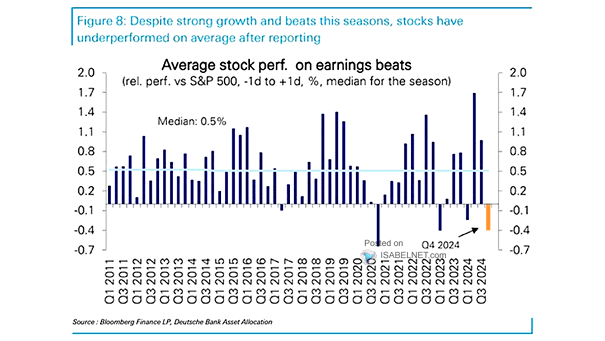
S&P 500 Aggregate Earnings Beat A 5% earnings beat reflects the typical surprises seen in past quarters and suggests that actual reported earnings will modestly exceed consensus estimates, consistent with the historical pattern of positive…
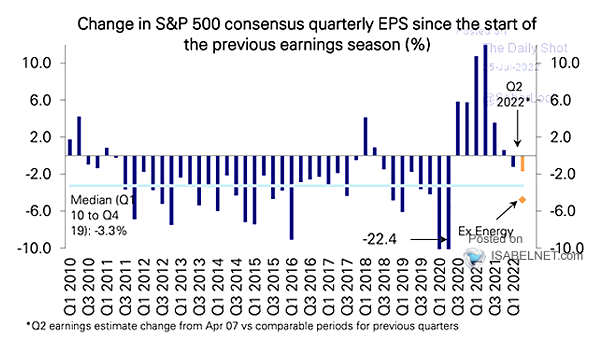
Evolution of Earnings Consensus After an initial wave of downward revisions, Q2 2025 consensus earnings estimates have stabilized and remained relatively flat over the past six weeks, with no significant cuts reported recently. Image: Deutsche…
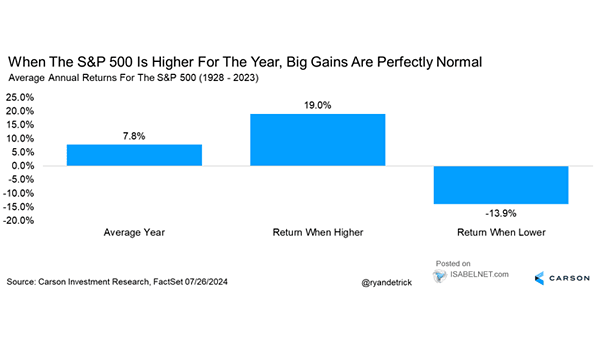
S&P 500 Annual Price Returns The S&P 500’s performance in 2025 so far aligns with median historical gains seen during non-recessionary periods. The market outlook remains cautiously optimistic, driven by moderate earnings growth and supportive…