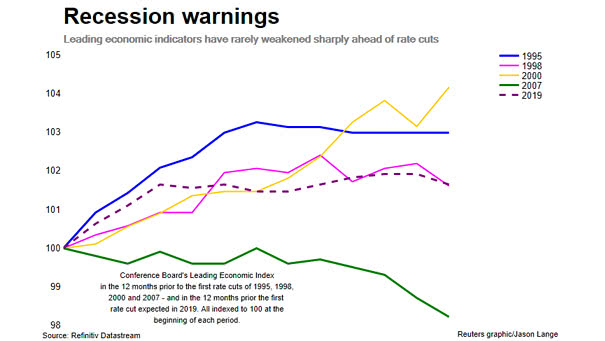
U.S. Unemployment Rate and Wage Growth
U.S. Unemployment Rate and Wage Growth U.S. unemployment rate at 3.7% and U.S. wage growth at 3.2% in July. U.S. employment growth slows, suggesting the U.S. economy is cooling. Image: Jeroen Blokland
The Equity Risk Premium May Be Bullish The equity risk premium suggests that the S&P 500 is not overvalued, which may be a bullish signal. You may also like our “Stock Market Equity Risk Premium.”…
ISM Manufacturing Index and U.S. Financial Conditions Index Great chart suggesting that the ISM Manufacturing Index could be below 50 soon, and bounce back due to the drop in interest rates around the world. Image:…
Equity Market Driven by Bonds Not Profits The chart shows a widening gap between cyclicals and bond proxies. It is clearly a cyclical bear market within a bull market, as during the dotcom bubble. Image:…
Cash Use vs. Internet Penetration Around the World Interesting correlation between the use of cash and the internet users as percentage of the population. Image: The Economist
Share of Negative Yielding Bonds in the World Excluding U.S. The chart shows that 43% of global bonds ex-U.S. trade at negative yields. Image: Deutsche Bank Global Research
How “NO-DEAL Brexit” Would Affect the World’s Economy? What could a no-deal Brexit mean for developing countries? Main losers if there is a no-deal Brexit: European Union and Turkey. Main winners if there is a…
Interest Rates for Personal Loans and Credit Cards Diverge Due to the growing spread, many borrowers take out personal loans to pay off credit card debt. Image: Axios
China Credit Impulse Leads World Trade The chart suggests that China credit impulse leads world trade by 12 months. World trade is expected to turn positive in coming months. Credit impulse is the change in…
ISM Manufacturing Index vs. S&P 500 The U.S. stock market is pricing in a strong rebound in the ISM Manufacturing Index (R² = 0.40 since 1997). Image: Deutsche Bank
U.S. 10-Year Treasury Bond Yield and U.S. 10-Year Nominal GDP The long-term trend in U.S. nominal GDP growth is a good indicator of U.S. nominal bond yields. Image: Goldman Sachs Global Investment Research