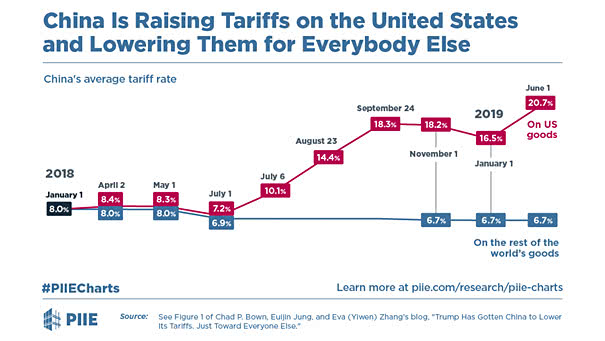
China is Raising Tariffs Only on the U.S.
China is Raising Tariffs Only on the U.S. Actually, China is lowering tariffs on other countries. Image: Peterson Institute for International Economics
China is Raising Tariffs Only on the U.S. Actually, China is lowering tariffs on other countries. Image: Peterson Institute for International Economics
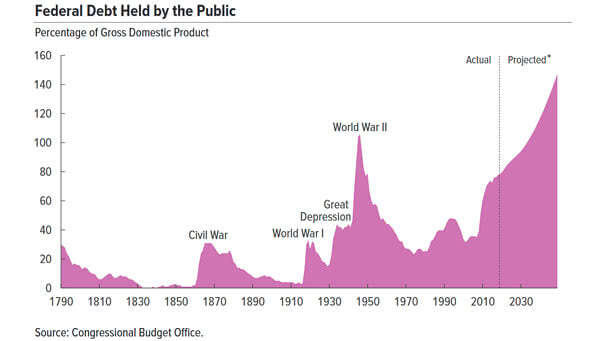
U.S. Federal Debt Held by the Public Rising U.S. federal debt could increase the likelihood of a fiscal crisis in the future. Image: Congressional Budget Office
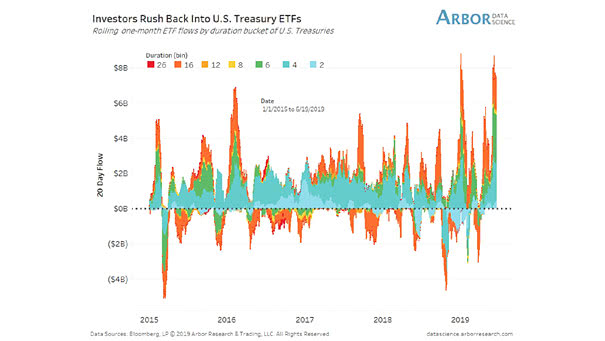
Investors Preference for U.S. Bond Funds Investors rush back into U.S. Treasury ETFs as trade and growth fears rise. Image: Arbor Research & Trading LLC
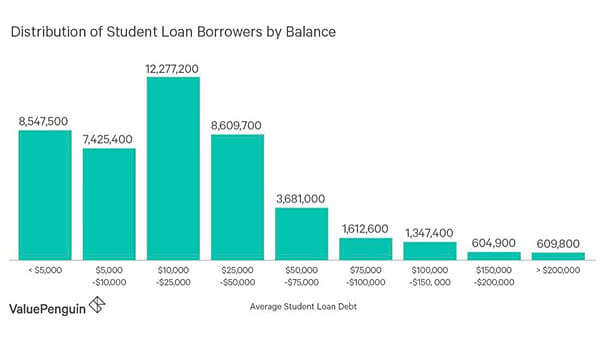
Distribution of Student Loan Borrowers by Balance Interesting chart showing that most student loan debts range between $10,000 and $25,000. You may also like “America’s Student Debt by State.” Image: ValuePenguin
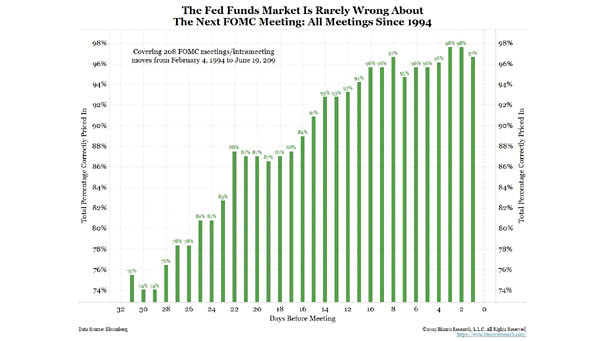
The Fed Funds Market Is Rarely Wrong About the Next FOMC Meeting Seven days before a FOMC meeting, the market has been accurate 95% of the time since 1994. Image: Bianco Research
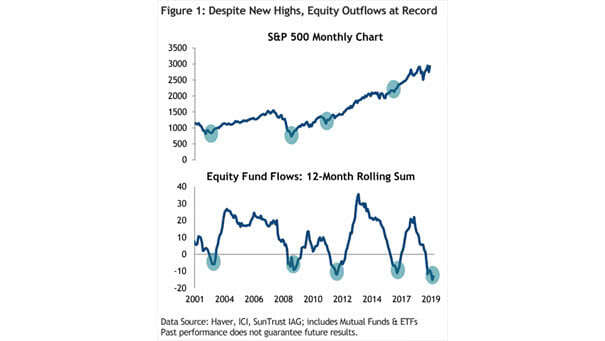
Equity Fund Outflows at Record History tell us that equities rose significantly. Image: SunTrust IAG
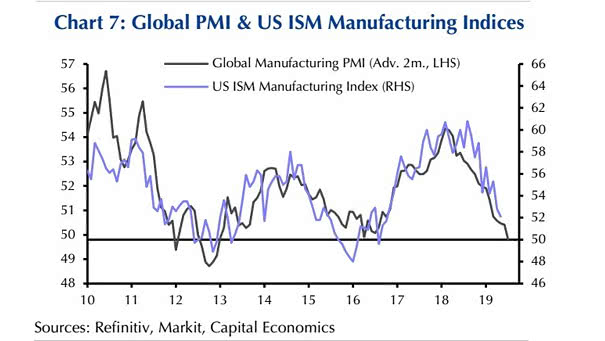
Global PMI & US ISM Manufacturing Indices This chart suggests that Global PMI Manufacturing Index leads US ISM Manufacturing Index by two months. Image: Capital Economics
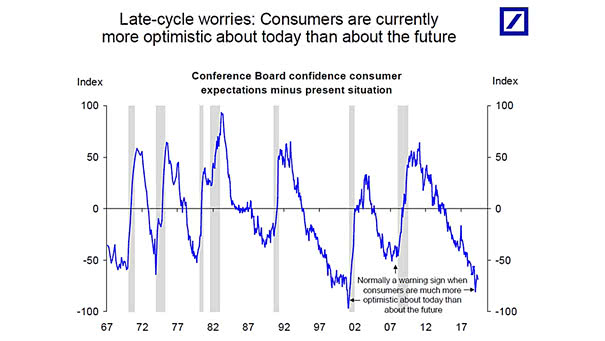
Late-cycle Worries Consumers are currently more optimistic today than about the future. That’s worrying because consumer spending contributes 70% of total U.S. production. Image: Deutsche Bank
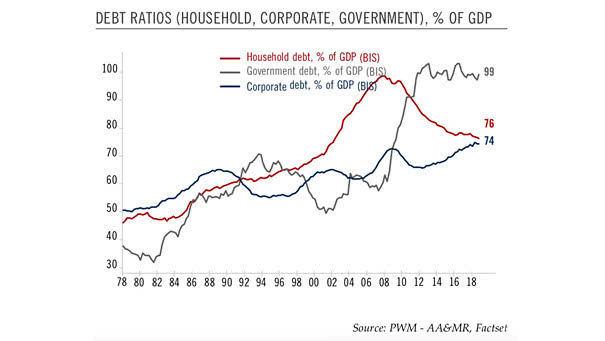
U.S. Debt Ratios to GDP (Household, Corporate, Government) U.S. households remain far less in debt than during the Great Recession, but U.S. corporate debt continues to rise rapidly and has exceeded record levels . Image: Pictet…

Follow Buffett’s Investment Principles: Great Investor Tom Russo Continues To Investing guru, Thomas Russo explains why he is a long-time holder of Berkshire Hathaway.
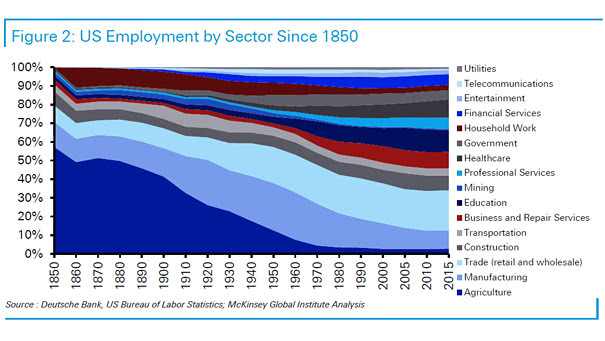
U.S. Employment by Sector since 1850 Over time, the U.S. employment became less dependent on agriculture and much more diversified. Image: Deutsche Bank