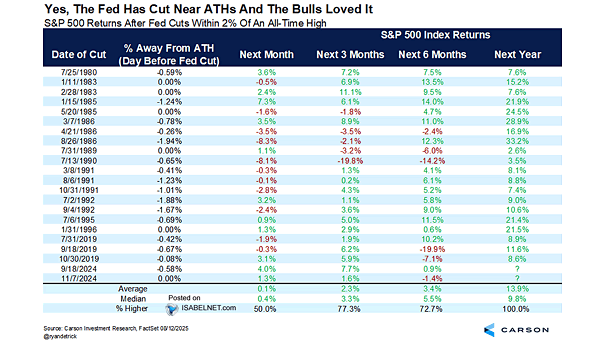
S&P 500 Returns After Fed Cuts Within 2% of an All-Time High
S&P 500 Returns After Fed Cuts Within 2% of an All-Time High Bears are losing ground as history leans bullish. Since 1980, when the Fed has eased policy while the S&P 500 traded within 2%…
S&P 500 Returns After Fed Cuts Within 2% of an All-Time High Bears are losing ground as history leans bullish. Since 1980, when the Fed has eased policy while the S&P 500 traded within 2%…
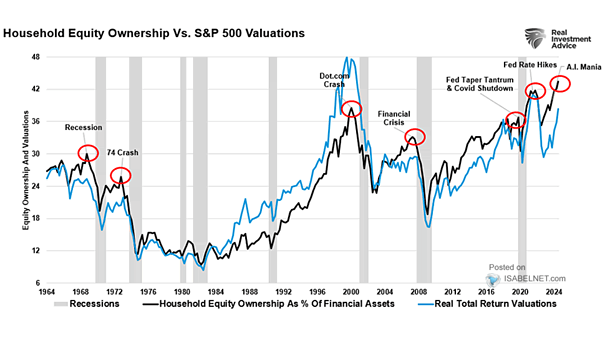
U.S. Household Equity Ownership vs. S&P 500 Index U.S. households have never been this heavily invested in stocks. The higher the concentration, the greater the risk that a market pullback hits both confidence and consumption,…
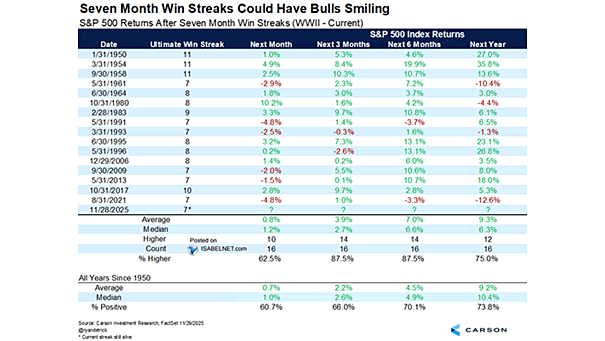
S&P 500 Returns After Seven Month Win Streaks Seven winning months in a row? Since 1950, the S&P 500 has pulled that off 16 times and history says momentum like this rarely cools: nine out…
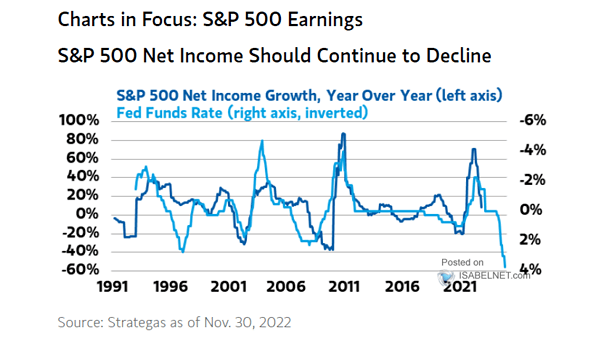
S&P 500 and Fed Funds Target Rate When the Fed cuts rates outside of a recession, U.S. stocks typically perform well. However, a perceived “too dovish” cut, signaling excessive economic worry, could disrupt the ongoing…
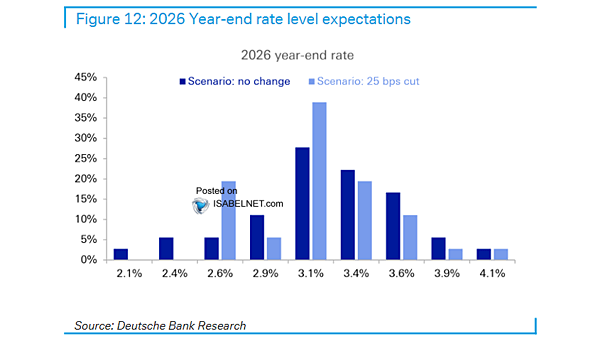
Fed Funds Rate – 2026 Year-End Rate Levels Expectations Deutsche Bank’s latest poll of 40 global market participants shows expectations for the fed funds rate at end-2026 anchored near 3.2%, regardless of whether Powell keeps…
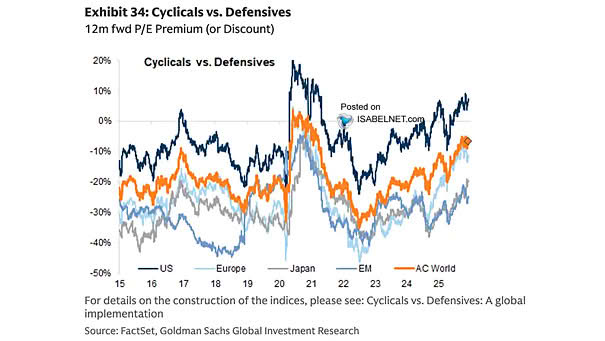
Cyclicals vs. Defensives – 12-Month Forward P/E Premium Cyclical stocks are leading the way in 2025, leaving defensives behind as optimism returns to markets. In the U.S., that surge has lifted cyclicals to a valuation…
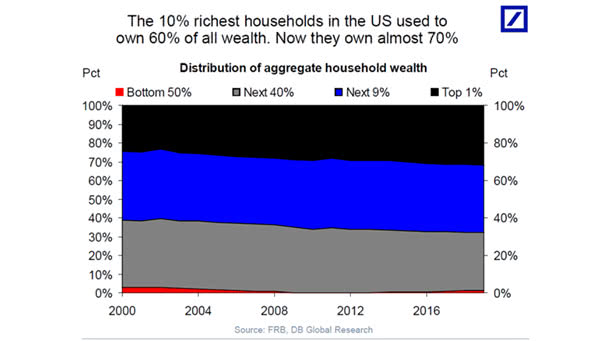
Wealth and Spending by Income Quintile in the U.S. The middle 60% of Americans control just 26% of the nation’s wealth but account for more than half of all spending. Whether they can keep it…
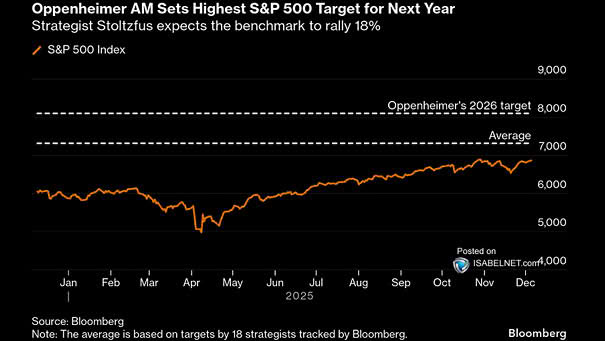
S&P 500 2026 Target Oppenheimer Asset Management expects the S&P 500 to surge 18% next year, lifting the index to 8,100 by end-2026 as solid growth, resilient earnings, and looser monetary policy keep the rally…
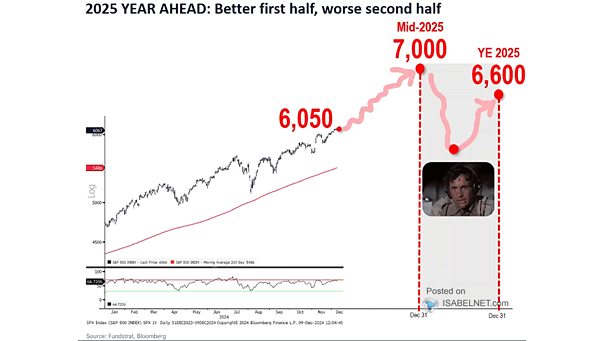
S&P 500 2026 Price Target Major banks see the S&P 500 averaging 7,500 by the end of 2026, roughly 10% above current levels. Deutsche Bank is the most bullish, calling for 8,000 as earnings broaden…
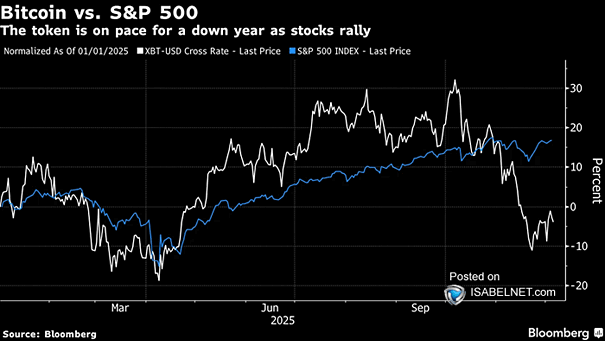
S&P 500 vs. Bitcoin Bitcoin usually tracks risk assets like equities, but in 2025 it broke away from the U.S. stock rally, surprising traders who expected a lift from President Donald Trump’s pro‑crypto stance and…
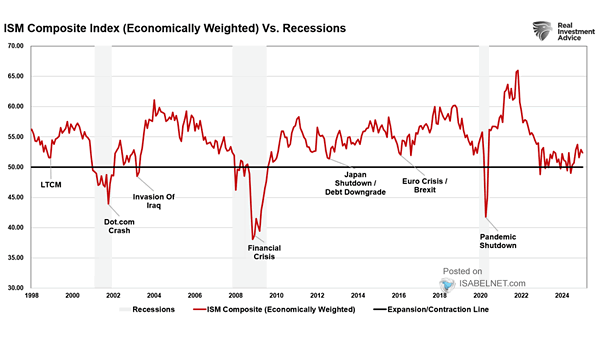
ISM Composite Index vs. Recessions The economically weighted ISM composite paints a picture of moderation. Growth has cooled, not cracked. Image: Real Investment Advice