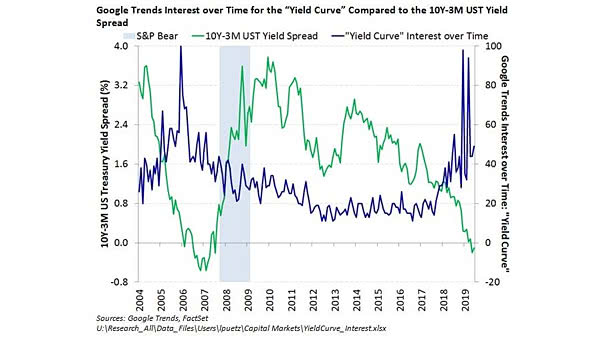
“Yield Curve” Google Trends vs. 10Y-3M Yield Spread
“Yield Curve” Google Trends vs. 10Y-3M Yield Spread This interesting chart shows the Google trends interest for the “yield curve” compared to the U.S. 10-year minus 3-month Treasury yield spread. If history helps us predict…