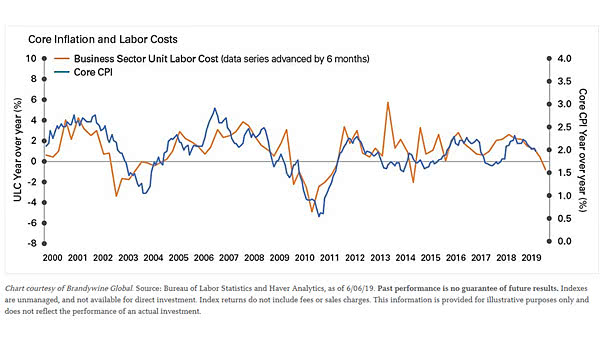
Percentage Change in S&P 500 in Previous Bull Markets
Percentage Change in S&P 500 in Previous Bull Markets The current bull market is nearly 3,750 days old, twice as long as the average bull market. This is also the longest bull market in the…
Just a Normal Day… “Just a normal day at the nation’s most important financial institution…” Image: Kevin “Kal” Kallaugher
MOVE, VIX and Rising Economic Uncertainty Markets are oddly calm despite rising economic uncertainty. Image: Financial Times
10-Year German Bund Yield and German Manufacturing PMI The 10-year German Bund yield could go positive again as recession fears dissipate. Image: Pictet Wealth Management
European Equities Lead Bund Yields by 6 Months Because European equities tend to lead bund yields by 6 months, bund yields should turn higher. Image: Reuters
Gold vs. Short-term Treasury Yield This chart shows the correlation between gold and 2-year treasury yield (inverse). Gold rises on slowing global growth and short-term treasury yield inverse. Image: Jeroen Blokland
CEO Confidence & Business Confidence Deutsche Bank points out that something happened to CEO confidence and business confidence when the trade war escalated in 2018H2. Image: Deutsche Bank Global Research
What is the Biggest Risk Right Now for Investors? What is the Biggest Risk Right Now for Investors? The risk of a Fed policy error The probability of a Fed rate cut in July 2019…
Initial Fed Rate Cuts and Resulting Forward Market Returns This spreadsheet also shows that the S&P 500 has performed well on average, around first Fed rate cut. Image: Fundstrat Global Advisors, LLC
Eurozone Inflation and Brent Oil Prices This interesting chart shows the direct effect of brent oil prices (YoY % change) on euro area inflation. Image: Jeroen Blokland