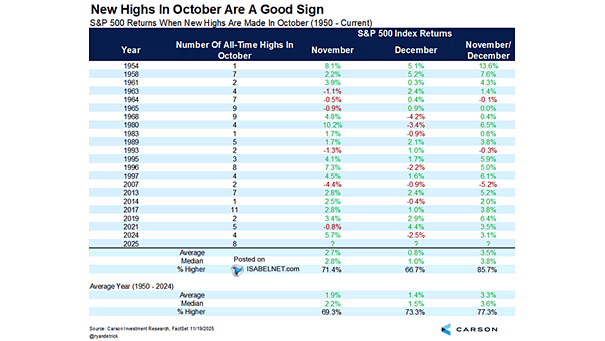
S&P 500 Returns When New Highs Are Made In October
S&P 500 Returns When New Highs Are Made In October A slow start to November may not tell the whole story. When the S&P 500 hits a new high in October, history leans bullish, with…
S&P 500 Returns When New Highs Are Made In October A slow start to November may not tell the whole story. When the S&P 500 hits a new high in October, history leans bullish, with…
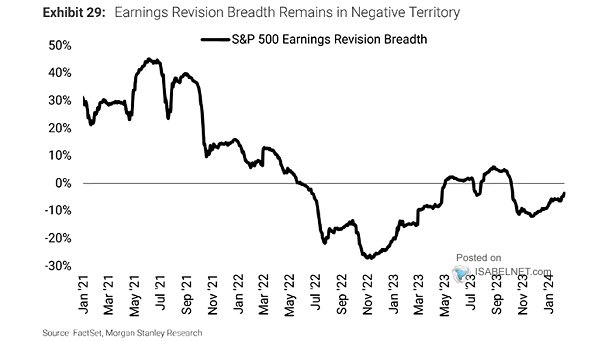
Citi U.S. Earnings Revision Index and S&P 500 Index The S&P 500’s bull market remains firmly in place, with upside potential into 2026 fueled by earnings upgrades and upbeat corporate guidance. Image: Bloomberg
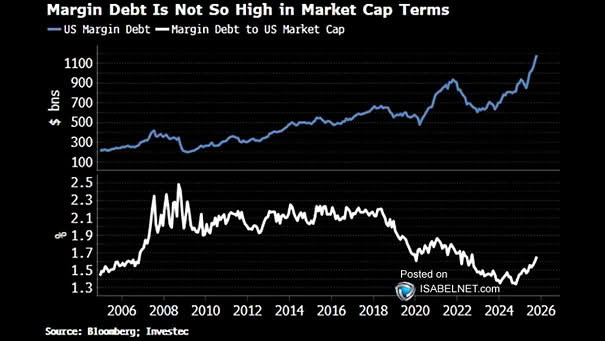
Margin Debt to U.S. Market Cap While margin debt has been rising, its share of total U.S. market value still sits at manageable levels. That keeps leverage risks in check and suggests investors could take…
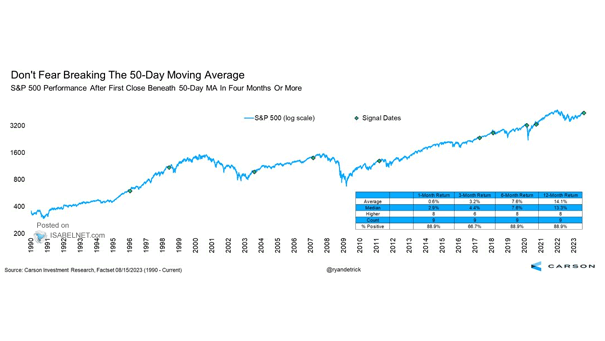
S&P 500 After Four Months Above the 50-Day MA Ends A break below the 50-day moving average after four months of strength might set off alarm bells, but history has usually rewarded patience. The S&P…
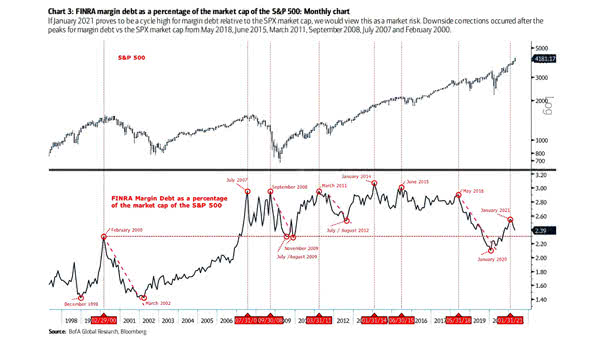
NYSE Margin Debt and S&P 500 Margin debt on the NYSE has seen the second fastest spike on record over the past six months. Spikes in margin debt at a much faster pace than broad…
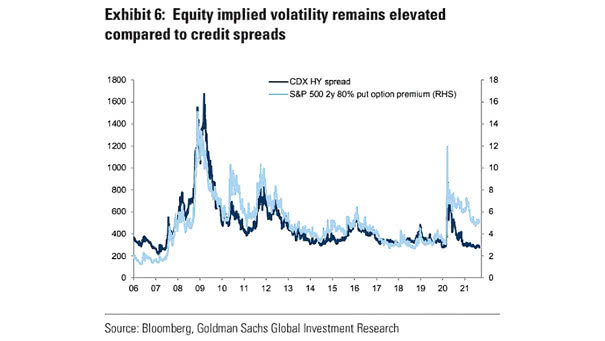
U.S. Equity Volatility vs. Credit Volatility Credit markets are calm, with volatility running below its long-term average, but equity volatility tells a different story, pointing to a more anxious tone in stocks. Image: Fundstrat Global…
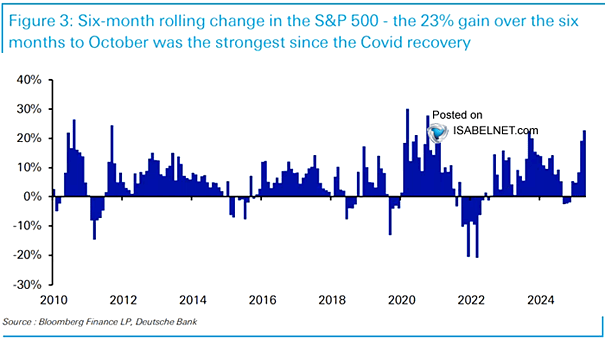
Rolling 6-Month % Change in the S&P 500 Following a six-month rally that sent the S&P 500 soaring 23% through October 2025, investors are beginning to wonder if the market still has fuel in the…
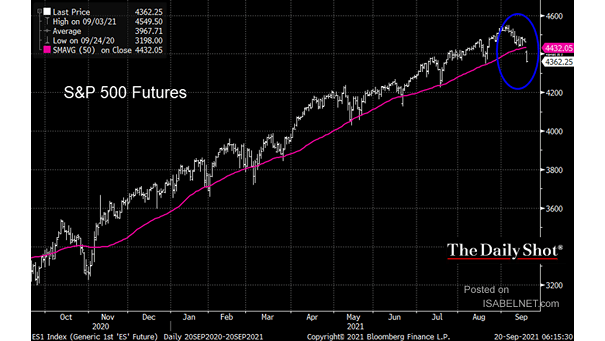
S&P 500 Consecutive Trading Sessions Above 50-Day Moving Average The S&P 500’s 138-day rally above its 50-day moving average has come to an end, snapping the index’s second-longest run this century and putting volatility back…
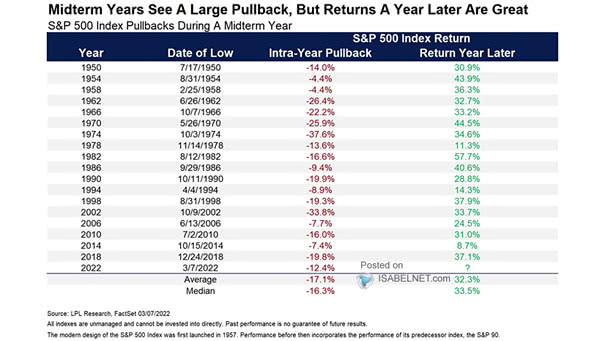
S&P 500 Index Peak-to-Trough During a Midterm Year Midterm years often bring large pullbacks — but history says don’t panic. Since 1950, every midterm-year bottom in U.S. stocks has been followed by a powerful rebound,…
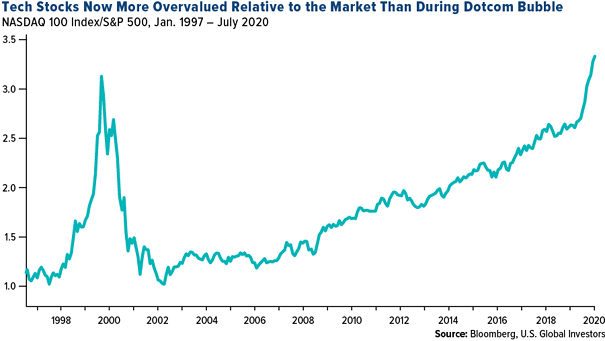
Nasdaq 100 Ratio to S&P 500 Equal Weighted After years of leaving the broader market in the dust, the Nasdaq 100’s outperformance over the average S&P 500 stock has lost steam, with recent data showing…
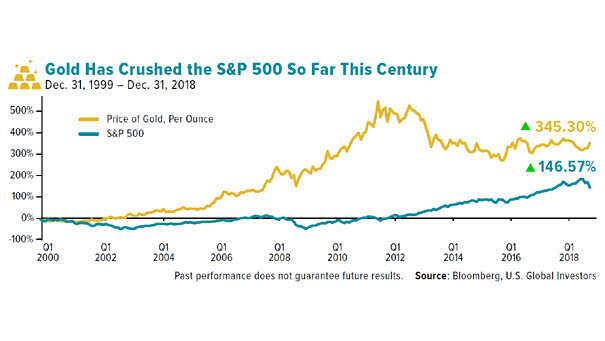
S&P 500 Total Return and Gold Return Gold’s shine isn’t dimming, even as U.S. stocks rally. Both are up together for a third straight year. Investors now view bullion as shelter with upside, and central…