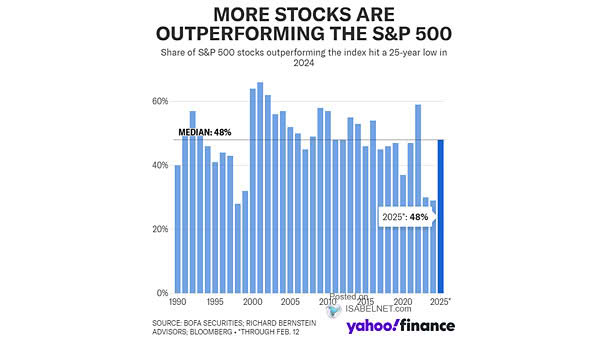
ISABELNET Cartoon of the Day
ISABELNET Cartoon of the Day With the S&P 500 jumping 4.59% last week, bulls are celebrating like they just hit the jackpot, while bears are trying to find their lost optimism! Have a Great Week,…
S&P 500 Performance After >70% Advancers Three Days in a Row on the NYSE Historically, three consecutive days with over 70% NYSE advancers signal strong bullish momentum. Since 1950, the S&P 500 has delivered positive…
S&P 500 2025 EPS Estimate After Tariff Impact Deutsche Bank slashed its 2025 S&P 500 EPS estimate to $240 (from $282) due to tariffs’ outsized burden on U.S. companies. The S&P 500 index could rally…
S&P 500 Forward Earnings and U.S. Dollar Index The weakening U.S. dollar is raising significant concerns for U.S. corporate earnings, particularly through its interplay with tariffs and global economic uncertainty. Image: Bloomberg
S&P 500 and Zweig Breadth Thrust Bulls have reason to smile as the Zweig Breadth Thrust has perfectly predicted S&P 500 gains in all 19 post-WWII instances, averaging 23.4% returns within a year and never…
Magnificent Seven Stocks vs. S&P 500 Index Since DeepSeek’s emergence in January 2025, the Magnificent Seven stocks have underperformed compared to the S&P 500, driven by AI disruption fears and concerns over capital expenditures. Image:…
ISABELNET Cartoon of the Day While bulls are toasting the S&P 500 gains this week, bears are busy Googling “emergency exits from a market rally.” Happy Friday, Everyone! 😎
S&P 500 and NYSE >70% Advancers Six Times Over a Two Weeks Period Six trading days with NYSE advancers exceeding 70% within a two-week period historically signal a robust bullish phase—distinct from bear-market rallies—with an…
U.S. 10Y-2Y Yield Curve While a steepening inverted yield curve has historically warned of recession, persistent economic strength could mean a more positive outlook for U.S. equities in 2025—though this would mark a notable break…
S&P 500 Drawdown and Insider Buying/Selling The Vickers insider sell/buy ratio, which tracks corporate insider transactions, indicates insiders perceive value at current price levels—a trend historically viewed as a bullish signal for market direction. Image:…
Gold vs. U.S. M2 and U.S. Debt to GDP Historically, gold prices have tracked the expansion of the money supply and have responded to increases in U.S. government debt. Image: J.P. Morgan Commodities Research