
ISABELNET Cartoon of the Day
ISABELNET Cartoon of the Day Saint Patrick’s Day brings smiles to bulls as it’s not only one of the greenest days of the year but also historically the best day for U.S. stocks in March—leaving…
ISABELNET Cartoon of the Day Saint Patrick’s Day brings smiles to bulls as it’s not only one of the greenest days of the year but also historically the best day for U.S. stocks in March—leaving…
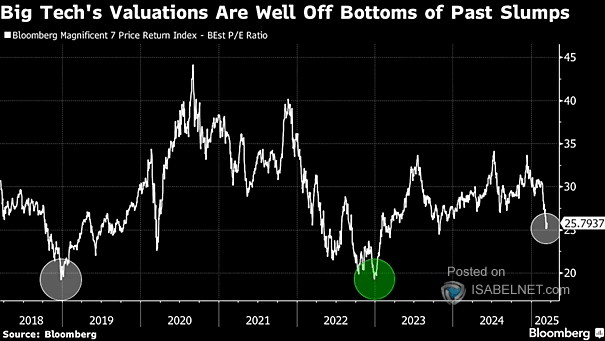
Valuation – Bloomberg Magnificent Seven Price Return Index – BEst P/E Ratio During the recent market selloff, valuations of major tech companies have plummeted from their previous highs. Many traders believe the downward trend may…
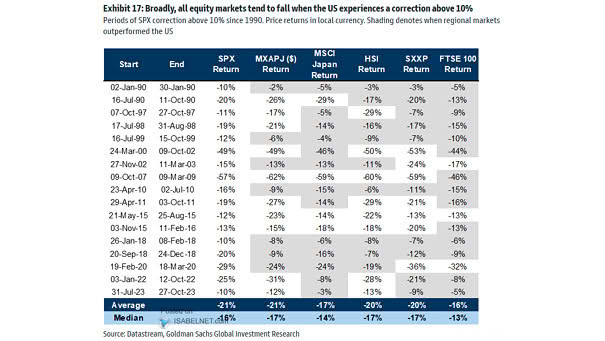
Periods of S&P 500 Correction Above 10% Due to the U.S. stock market’s dominant position, a correction exceeding 10% frequently triggers a domino effect across global equity markets, as investors react to heightened uncertainty and…
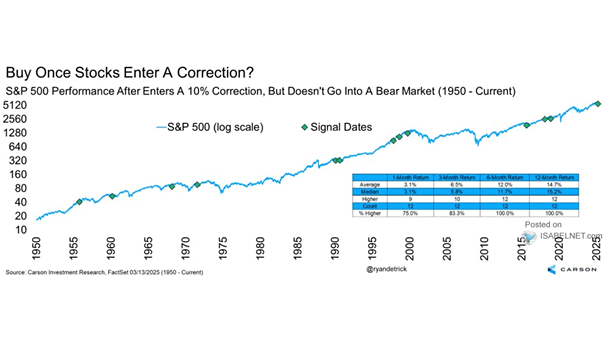
S&P 500 Performance After Enters a 10% Correction, But Doesn’t Go into a Bear Market Historically, when the S&P 500 falls 10% without entering a bear market, it’s a potential buying opportunity. Since 1950, it…
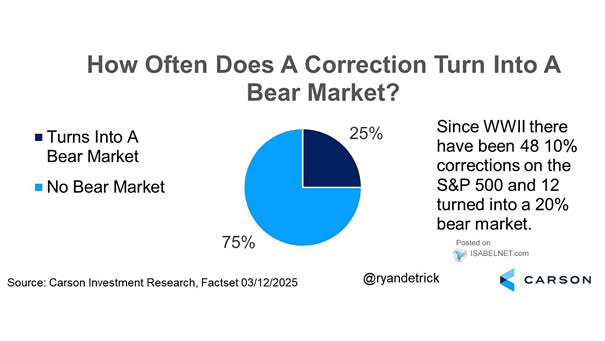
How Often Does a Correction Turn into a Bear Market? Historically, a 10% correction rarely leads to a 20% bear market without economic downturns, earnings declines, or rate hikes. With no very serious adverse indicators…

ISABELNET Cartoon of the Day As U.S. stocks tumble, bears are writing eulogies for the market. Bulls, on the other hand, are buying the dip like there’s no tomorrow, which is ironically what bears foresee!…
ISABELNET Cartoon of the Day February’s CPI inflation drops to 2.8%, beating the 2.9% forecast. On CPI days, bulls are like kids in a candy store, while bears sit in the corner, sulking like they…
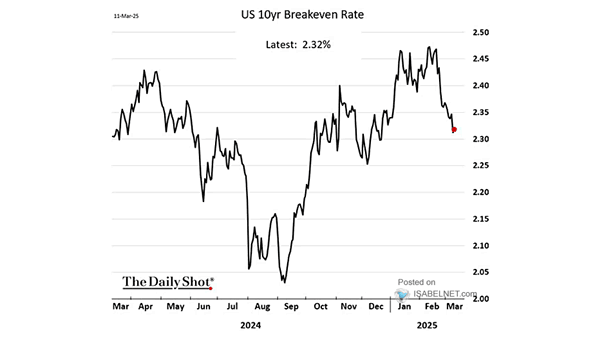
Inflation – U.S. 10-Year Breakeven Rate The declining U.S. 10-year breakeven inflation rate indicates that market participants expect inflation to moderate, aligning with the Fed’s 2% long-term target. Image: The Daily Shot
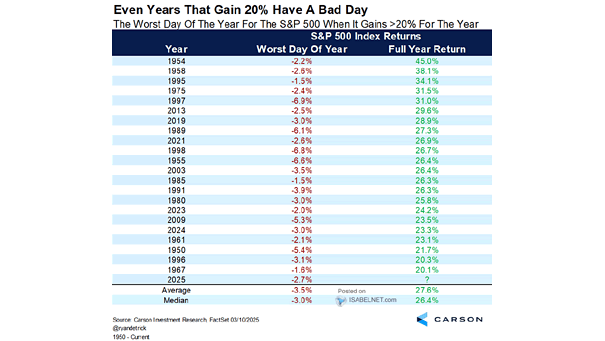
The Worst Day of the Year for the S&P 500 When It Gains >20% for the Year Monday saw the S&P 500 drop 2.7%, its worst day this year. Even in years with strong returns…
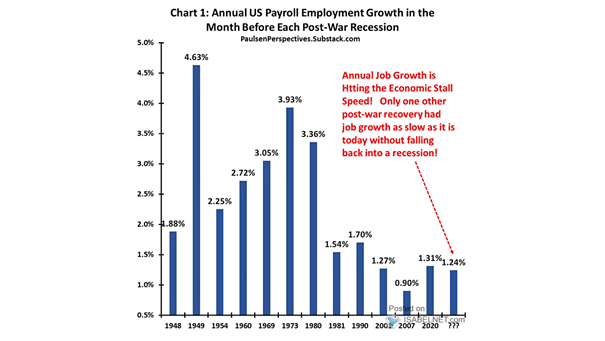
Annual U.S. Payroll Employment Growth in the Month Before Each Post-War Recession The recent slowdown in U.S. job creation is concerning, as it nears levels typically seen before economic downturns. Image: Paulsen Perspectives

ISABELNET Cartoon of the Day Wall Street bears believe every bull market is just a bear market in disguise. When the crash comes, they can’t resist saying, “We knew it all along!” Happy “Hump” Day,…