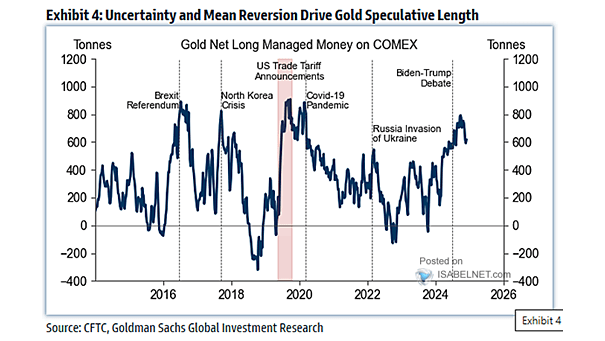
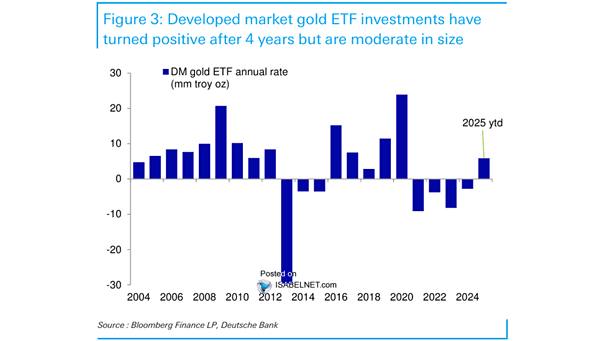
Each Component of the Speculative Trading Indicator Screens as Elevated vs. History

Each Component of the Speculative Trading Indicator Screens as Elevated vs. History All three core components of Goldman Sachs’s speculative trading indicator—unprofitable, penny, and high EV/sales stocks—are trading near the extreme upper deciles, reflecting a highly speculative market environment right now. Image: Goldman Sachs Global Investment Research

U.S. Money Supply M2

U.S. Money Supply M2 The pickup in the U.S. M2 money supply matters because it signals increasing liquidity that—if excessive relative to economic output and accompanied by rising velocity—could reignite inflationary pressures. Image: Deutsche Bank

Reserves in Different Currencies

Reserves in Different Currencies While the USD share of global FX reserves has slipped somewhat, it remains close to 60% and continues to be the leading global reserve currency by a wide margin. Image: Deutsche Bank

S&P 500 vs. 60/40 Portfolio

S&P 500 vs. 60/40 Portfolio Since 2020, the S&P 500 has delivered higher returns than the 60/40 portfolio but with greater volatility, while the 60/40 portfolio has provided more stability at the cost of lower overall gains. Image: Bloomberg

S&P 500 vs. Liquidity Index

S&P 500 vs. Liquidity Index A slowdown in liquidity growth—particularly if combined with soft economic data—poses a short-term risk to the U.S. equity market, increasing volatility and the likelihood of price declines. Image: TS Lombard

Magnificent Seven Earnings Growth Expectations and Delivered

Magnificent Seven Earnings Growth Expectations and Delivered The Mag 7 companies are currently the dominant force behind S&P 500 earnings growth, with an expected 14% year-over-year growth in Q2 2025, far exceeding the remainder of the S&P 500 index. Image: J.P. Morgan

Average Relative Performance of S&P 500 Additions

Average Relative Performance of S&P 500 Additions Stocks added to the S&P 500 index typically experience their strongest outperformance before the official announcement, as market participants anticipate and position for the change. Image: Goldman Sachs Global Investment Research

M2 Money Supply Growth

M2 Money Supply Growth U.S. money supply growth has robustly returned to near its long-term trend. In contrast, the euro area has experienced a slight slowdown in money supply growth recently, although growth rates remain positive. Image: Deutsche Bank

Gold Seasonality

Gold Seasonality Gold benefits from strong seasonal and technical momentum, supported by central bank demand, inflation concerns, and geopolitical risks, positioning it for a likely significant price breakout in the coming months. Image: Renaissance Macro Research

Two-Year Rolling Change in the Fed Funds Rate

Two-Year Rolling Change in the Fed Funds Rate Current rate cut expectations, as priced in by fed funds futures, are consistent with a recession scenario. However, market risk indicators and recent Fed communications suggest this may overestimate the pace of Fed rate cuts. Image: Deutsche Bank