Fear & Greed Index – Investor Sentiment
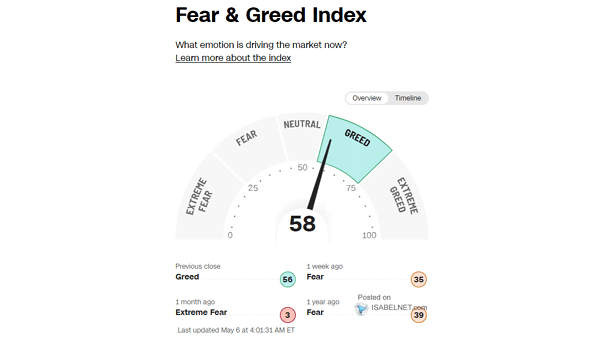
Fear & Greed Index – Investor Sentiment A Fear & Greed Index reading of 75 indicates strong bullish sentiment and optimism but also warns that the U.S. stock market may be poised for a pullback or consolidation. Image: Cable News Network