Foreign Holdings of U.S. Treasury Securities
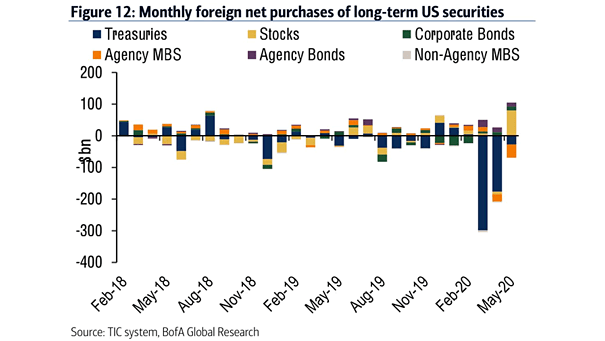
Foreign Holdings of U.S. Treasury Securities U.S. Treasuries continue to draw strong foreign demand. Holdings rose to a record $9.37 trillion in May, but the buying power has passed from foreign central banks to private balance sheets. That marks a structural shift. Image: Real Investment Advice