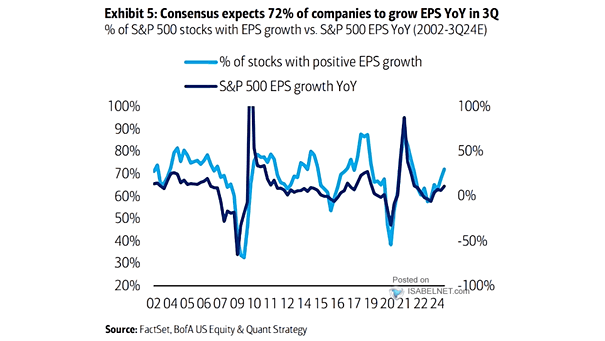
NAAIM vs. S&P 500 Index

NAAIM vs. S&P 500 Index Active investment managers frequently face criticism for their consistent pattern of selling equities at market bottoms and buying them at market tops. Image: Real Investment Advice

America’s Magnificent Seven Stocks

America’s Magnificent Seven Stocks The Magnificent Seven remain relatively expensive compared to the rest of the S&P 500 index, but their consistent performance and potential for growth continue to attract investors seeking long-term value. Image: BofA US Equity & Quant Strategy

Short Interest as % of Market Capitalization S&P 500 Median

Short Interest as % of Market Capitalization S&P 500 Median With a median short interest level of 1.8%, which remains relatively low, market participants are positive or cautiously optimistic about the future performance of the S&P 500. Image: Goldman Sachs Global Investment Research

Bitcoin vs. Gold

Bitcoin vs. Gold Bitcoin’s current price shares similarities with the price of gold in the 1970s. Image: Alpine Macro

U.S. Headline Inflation and U.S. Core PCE inflation

U.S. Headline Inflation and U.S. Core PCE inflation Goldman Sachs expects U.S. PCE inflation to converge to 2% in late 2025, which could lead to a more predictable and stable economic landscape for U.S. consumers. Image: Goldman Sachs Global Investment Research

CEO Confidence

CEO Confidence The recent improvement in CEO confidence in the U.S. indicates a renewed sense of optimism among business leaders. This is a significant development that can have far-reaching effects on the U.S. economy and business landscape. Image: BofA Global Research

Ranked Cross Asset Returns by Year

Ranked Cross Asset Returns by Year Gold continues to maintain its position as the best performer thus far in 2024, with consistent gains and a resilient performance. Image: BofA Global Investment Strategy Click the Image to Enlarge

Gold Price

Gold Price Gold prices tend to rise as U.S. public debt increases, suggesting a clear correlation between the two. Image: BofA Global Investment Strategy

U.S. Stock Market Bull and Bear Indicator

U.S. Stock Market Bull and Bear Indicator Using multiple financial data, this great model helps investors navigate through different market conditions. It suggests whether the U.S. stock market tendency is bullish, bearish or neutral. It is a contrarian indicator. A bullish signal suggests that the U.S. stock market may go up, while a bearish signal…