Insider Transactions Ratio
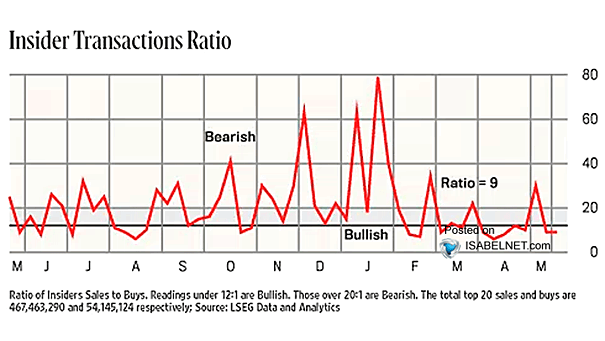
Insider Transactions Ratio Corporate insiders are turning more cautious as the Insider Transactions Ratio slips back into bearish territory, with little sign of buying interest. Image: Barron’s
Insider Transactions Ratio Corporate insiders are turning more cautious as the Insider Transactions Ratio slips back into bearish territory, with little sign of buying interest. Image: Barron’s
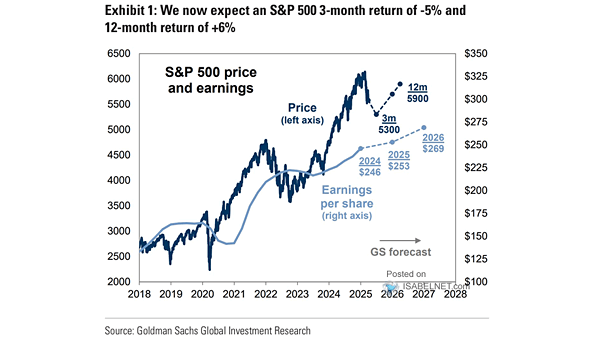
S&P 500 Price Target for 2026 Goldman Sachs continues to see steady earnings growth as the driver behind a 17% climb in the S&P 500 to 8,000 in 2026, though volatility is likely to stick around. Image: Goldman Sachs Global Investment Research
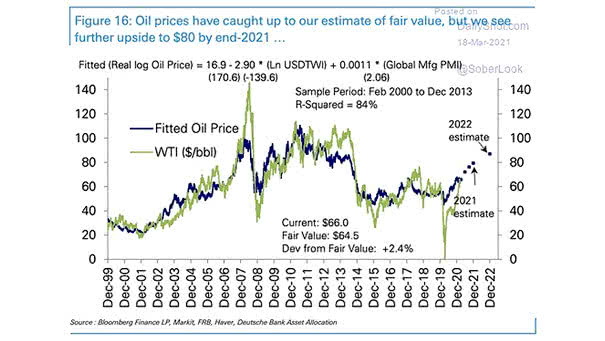
Oil Price Fair Value Oil is trading more than 50% above its estimate of medium-term fair value. Outside the 2022 shock peak, the market has rarely looked this stretched, leaving plenty of room for a pullback if conditions normalize. Image: Deutsche Bank Asset Allocation
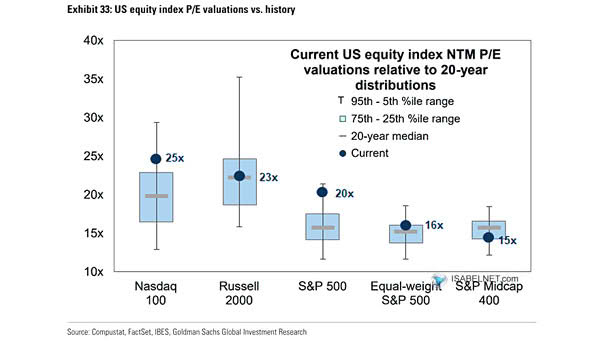
U.S. Equity Index P/E Valuations vs. History The appetite for risk is still there. The Russell 2000 trades at 25 times forward earnings, versus 24 for the Nasdaq 100 and 20 for the S&P 500. It looks pricey, but investors are still chasing stocks. Image: Goldman Sachs Global Investment Research
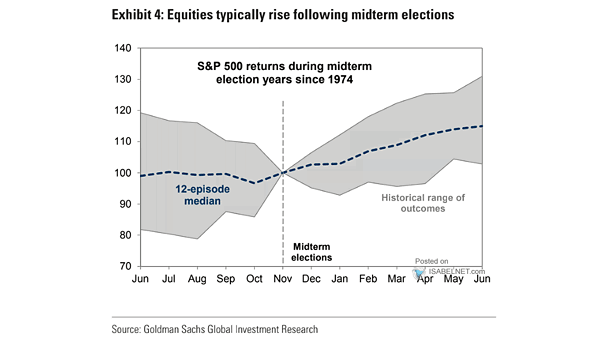
S&P 500 Returns Around Midterm Elections Ahead of midterm elections, U.S. equities have often gone sideways, with volatility rising and performance typically improving after the vote as uncertainty fades. Image: Goldman Sachs Global Investment Research
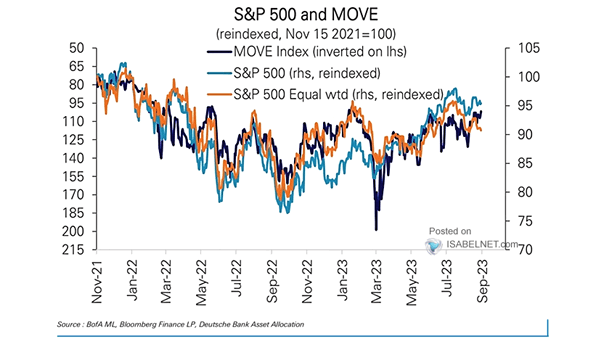
MOVE Index vs. S&P 500 The S&P 500 has been moving in the opposite direction of rate volatility. Stocks remain sensitive to swings in rates, but if volatility cools and the outlook becomes more predictable, stocks may calm down even if rates stay high. Image: The Daily Chartbook
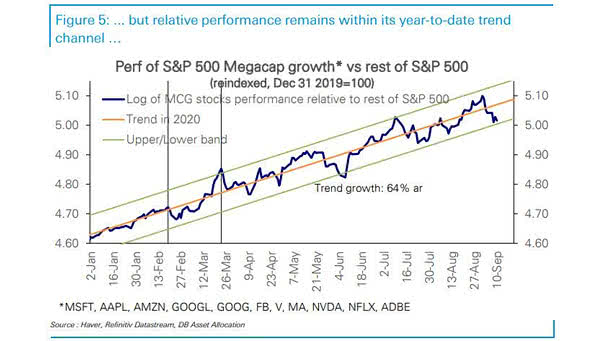
Performance – S&P 500 MCG & Tech Ratio to the Rest of the S&P 500 The rotation out of mega-cap tech is still in progress, but it looks more like an unwind of crowded positioning than the start of a new regime. Image: Deutsche Bank Asset Allocation
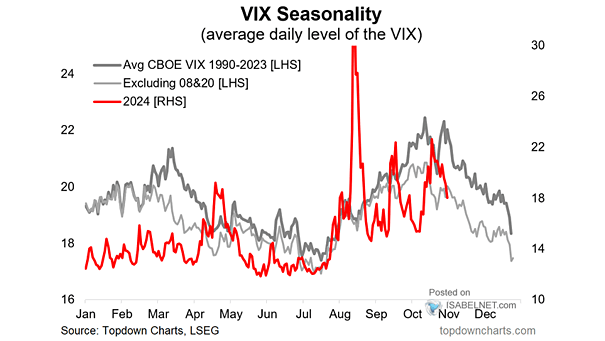
VIX Seasonality There’s a seasonal tendency for volatility to pick up at this time of year. As it climbs from late July into the autumn months, that can make for a trickier period for U.S. stocks. Image: Topdown Charts
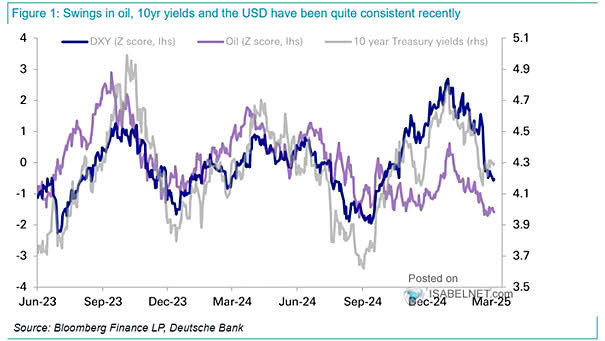
U.S. 10-Year Treasury Yield vs. Crude Oil (USO) Oil and yields have moved together since the Middle East conflict started in February. But that correlation often weakens once tensions cool. Image: Real Investment Advice
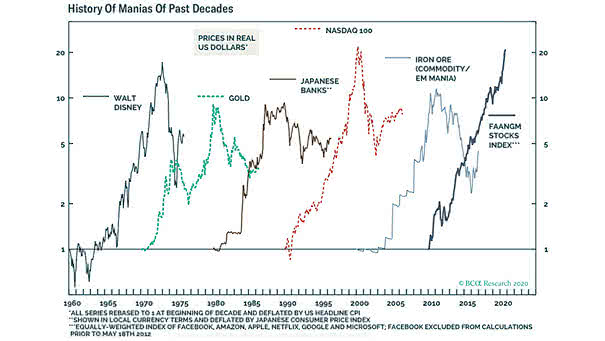
History of Asset Bubbles Past 60-Years The AI rally is powering investor enthusiasm, with semiconductor names among the biggest winners. It’s also reviving talk of past hype cycles and whether the run can last. Image: BCA Research
Hyperscaler Capex Estimates by Year Wall Street has been underestimating the scale of hyperscaler spending on AI infrastructure. What looked like a one-time wave now looks more like a multiyear arms race across data centers, chips, networking, and power. Image: BCA Research