Fear & Greed Index – Investor Sentiment
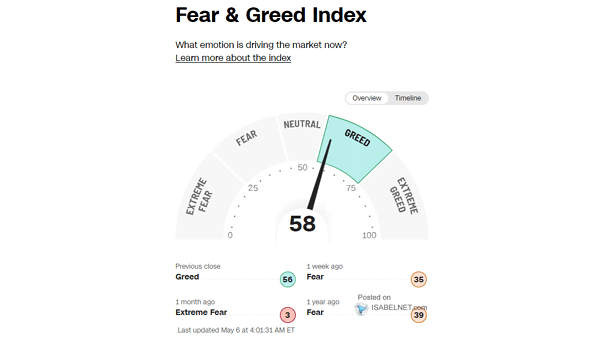
Fear & Greed Index – Investor Sentiment At 38 on the Fear & Greed Index, the market is in fear but not panic mode, which keeps the door open for a slow grind higher in U.S. stocks if news flow improves. Image: Cable News Network