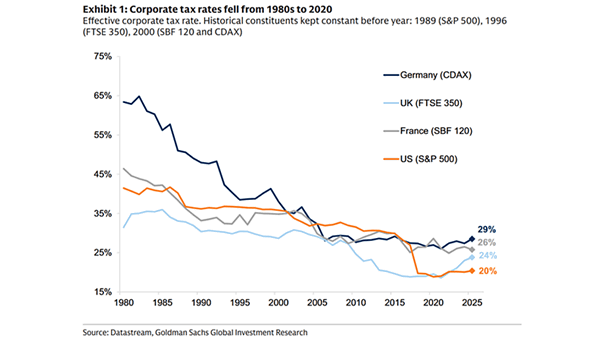
S&P 500 YoY EPS Growth

S&P 500 YoY EPS Growth Wall Street’s 2026 playbook starts solid and gets stronger, with S&P 500 earnings seen up 12% year over year in Q1 and then picking up pace to roughly 20% growth through year-end. Bulls have something to work with. Image: Goldman Sachs Global Investment Research

S&P 500 and Prediction Market Odds of the End to the Iran Conflict

S&P 500 and Prediction Market Odds of the End to the Iran Conflict U.S. stocks advanced as the geopolitical mood brightened. The S&P 500 has followed every twist in expectations around the Iran conflict. Right now, sentiment is in the driver’s seat, not fundamentals. Image: Goldman Sachs Global Investment Research

U.S. 10 Year Yield and S&P 500

U.S. 10 Year Yield and S&P 500 For equities, focus less on where rates are and more on how fast they’re moving. U.S. stocks have rarely shown a strong link to the absolute level of rates, even when those levels are high by historical standards. Image: Deutsche Bank Asset Allocation

S&P 500 and Three Weeks of +3% Gains in a Row

S&P 500 and Three Weeks of +3% Gains in a Row The S&P 500 notched a third straight week of gains above 3%. Moves like this usually show up in snapback rallies after panic selling, not when stocks are hovering at record highs. Image: Bloomberg

U.S. Real Retail Sales and Recession

U.S. Real Retail Sales and Recession U.S. real retail sales stand at 0.66% YoY. About 70% of U.S. GDP is personal consumption. In the past, U.S. real retail sales trended sideways before the recession began.

S&P 500 Bull Markets

S&P 500 Bull Markets Over the past 50 years, the average U.S. bull market has run for eight years and delivered a 288% gain. At just 3.5 years old and up roughly 100%, this rally still appears to have room to run, leaving the bears increasingly frustrated. Image: Carson Investment Research

MSCI World Sector/Style Valuations

MSCI World Sector/Style Valuations Valuations across many sectors and styles remain stretched, leaving investors with little margin for error. That’s what makes this market tricky. If sentiment shifts, there’s hardly any cushion. Image: Goldman Sachs Global Investment Research

Discretionary vs. Systematic Equity Positioning

Discretionary vs. Systematic Equity Positioning Systematic strategies sit in the 46th percentile, while discretionary investor positioning is at the 57th percentile, keeping the door open to add exposure. Image: Deutsche Bank Asset Allocation

Performance of S&P 500 Megacap Growth Stocks vs. Rest of S&P 500

Performance of S&P 500 Megacap Growth Stocks vs. Rest of S&P 500 Mega-cap growth and tech stocks are pushing higher from the bottom of their longer-term trend channel against the S&P 500, with momentum still firmly in place. It is tough to fade tech when it is trading like this. Image: Deutsche Bank Asset Allocation

Probability of U.S. Recession Over the Next 12 Months

Probability of U.S. Recession In the Next 1 Year The market is pricing in just a 13% chance of a U.S. recession over the next year, while Goldman Sachs sees it closer to 30%. Is the market too complacent? Image: Goldman Sachs Global Investment Research

Market Breadth – Percent Below 52-Week High S&P 500 Index Less Median Stock

Market Breadth – Percent Below 52-Week High S&P 500 Index Less Median Stock Market breadth across the S&P 500 faded during the latest rally, raising doubts about how much real strength sits behind the index. That’s not the kind of setup bulls like to see. Image: Goldman Sachs Global Investment Research