
Materials Group Positioning
Materials Group Positioning Positioning in materials has collapsed to extreme lows, leaving investors sharply underweight. A small shift in sentiment could fuel a powerful rebound. Image: Deutsche Bank Asset Allocation
Materials Group Positioning Positioning in materials has collapsed to extreme lows, leaving investors sharply underweight. A small shift in sentiment could fuel a powerful rebound. Image: Deutsche Bank Asset Allocation
Drawdown from 52 Week High of Various Global Tech Sectors or Tech Sensitive Indices Global tech and the usual tech‑sensitive indices are trading well below their 52‑week highs. This is the kind of year that follows a crowded AI trade, when investors finally see the bill for all that optimism. Image: Deutsche Bank
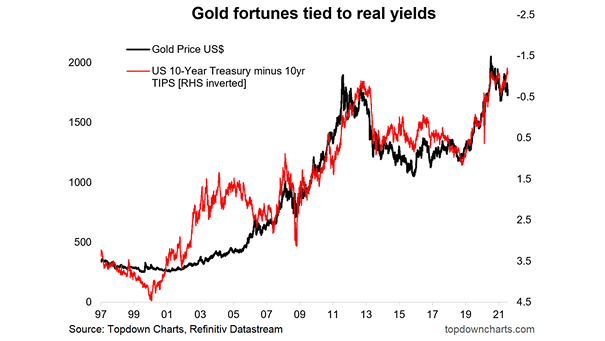
Gold Price vs. Market Pricing of 25bp Fed Hikes (Inverted) Gold struggles as energy‑driven inflation keeps Fed rate‑hike risks alive, lifting the dollar and real yields and capping near‑term gains for bullion. Image: Goldman Sachs Global Investment Research
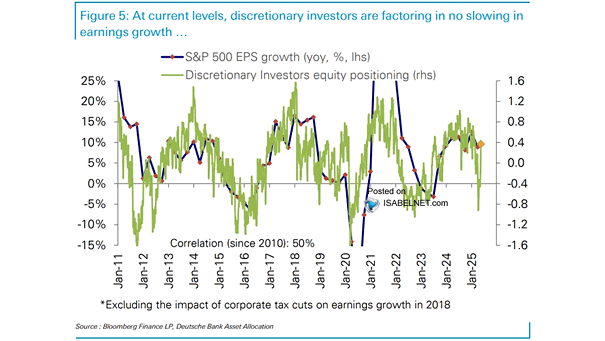
MCG & Tech vs. The Rest Earnings Growth Earnings growth for MCG and Tech is expected to keep accelerating from already lofty levels, while profits for the rest of the S&P 500 are projected to rise 14.3%, contributing 9.1 percentage points to overall growth. Image: Deutsche Bank Asset Allocation
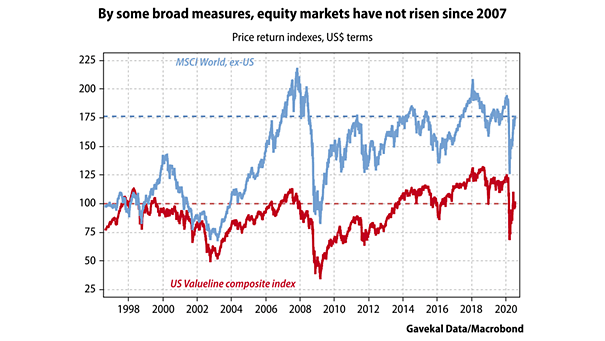
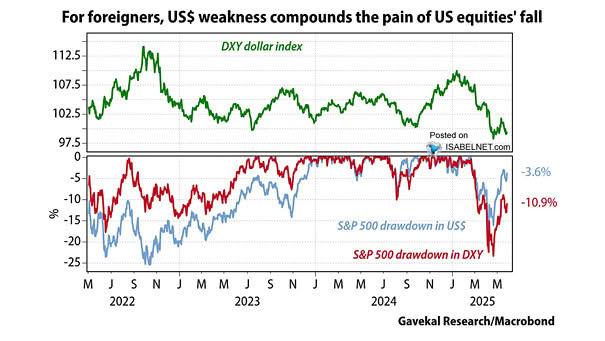
MSCI Equity Indexes, Total Return in US$ Since Trump’s inauguration, U.S. equities have lagged their global peers, with Europe ahead by 12%, Japan by 17%, and emerging markets by 27%. Image: Gavekal, Macrobond
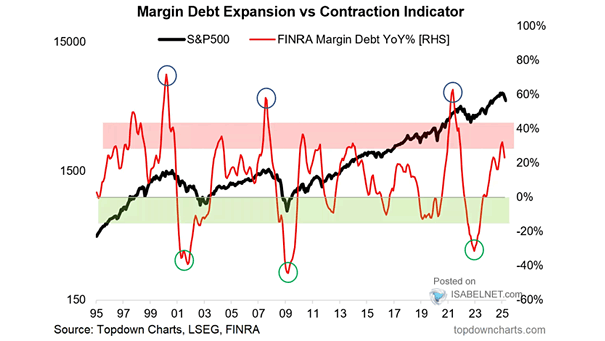
S&P 500 – Margin Debt Expansion vs. Contraction Margin debt is climbing into the danger zone that makes investors uneasy, edging deeper into levels last seen at major market tops. The bulls still run the show, but even a modest pullback could turn ugly fast. Image: Topdown Charts
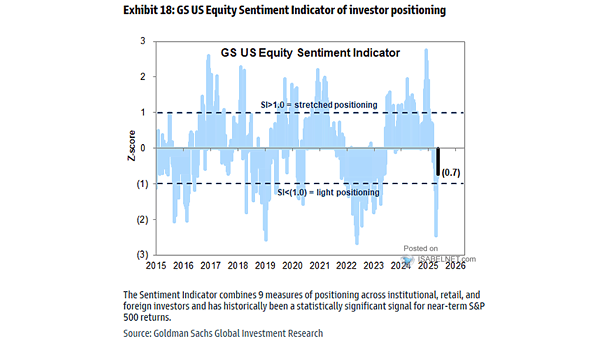
Sentiment Indicator and Stock Positioning Goldman Sachs’ U.S. equity sentiment indicator stands at 0.9, a level that has historically been followed by an average 1.1% gain in the S&P 500 over the next month.. Image: Goldman Sachs Global Investment Research
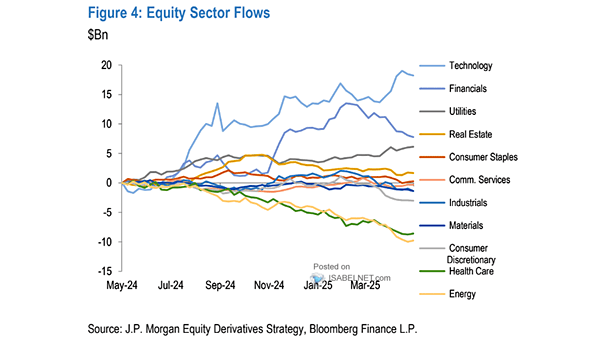
Sector Fund Flows Despite the selloff, semiconductors have seen heavy inflows over the past few weeks. That looks more like dip buying than broad risk aversion. Will it last? Image: Deutsche Bank Asset Allocation
MSCI ACWI 12-Month Forward EPS With global stocks priced for perfection and ACWI earnings expectations stretched, it looks prudent to take some risk off the table. Image: TS Lombard
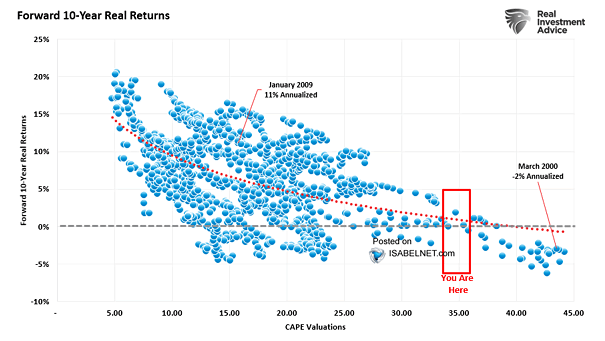
S&P 500 CAPE Valuations and 10 Year Annualized Real Return With the S&P 500 Shiller CAPE Ratio near rare highs, the market looks priced for perfection. History says that kind of setup often leads to weaker real returns down the road. That is not a comfortable backdrop for risk. Image: Real Investment Advice
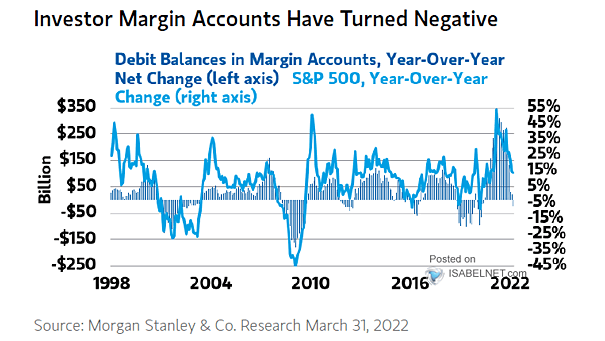
S&P 500 – Net Debit Balances in NYSE Margin Accountsge The ongoing investor deleveraging wave since June is a near-term headwind for U.S. equities, especially in technology and high-beta momentum stocks. Image: J.P. Morgan Flows and Liquidity