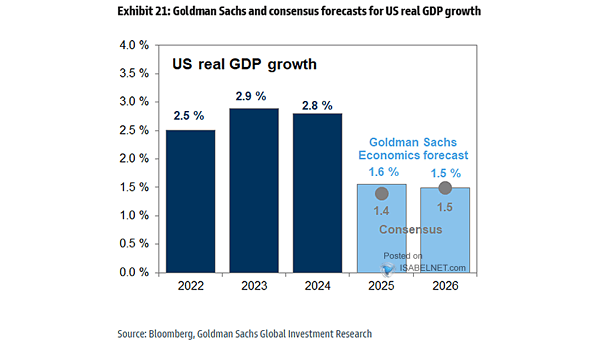
Smoothed U.S. Recession Probabilities

Smoothed U.S. Recession Probabilities The probability of U.S. recession stands at 0.44%. When this recession indicator exceeds 5% (red line), history suggests that the probability of recession increases significantly. The chart shows the smoothed U.S. recession probabilities indicator on a log scale. Smoothed U.S. recession probabilities are obtained from a dynamic-factor markov-switching model applied to…

S&P 500 Trend Channel

S&P 500 Trend Channel The S&P 500 caught up to the bottom of the trend channel in place since October 2022. If buyers defend this level, the index could keep grinding higher along that support. Image: Deutsche Bank Asset Allocation

U.S. Share Buyback Authorization Announcements

U.S. Share Buyback Authorization Announcements Buybacks are fueling the rally on Wall Street, with U.S. authorizations exceeding a record $860 billion since the start of the year and reinforcing a strong floor for equities. Image: Goldman Sachs Global Investment Research

The IPO Fade – % Change from Day-One Peak by Cohort

The IPO Fade – % Change from Day-One Peak by Cohort Buying into the SpaceX IPO is a bet on hype as much as fundamentals, and history points to a volatile debut. Early investors should be ready for swings and keep dry powder until the first results bring clarity. Image: Real Investment Advice

S&P 500 Performance After Day 100 Is Up >9% YTD

S&P 500 Performance After Day 100 Is Up >9% YTD Momentum, once built, rarely fades quickly. When the S&P 500 is up more than 9% by day 100, the rest of the year has historically delivered a median gain of 11.1% since 1950, keeping bulls smiling. Image: Carson Investment Research

U.S. Heavy Truck Sales and Recessions (Leading Indicator)

U.S. Heavy Truck Sales and Recessions (Leading Indicator) U.S. heavy truck sales slightly in April to 398K (annualized). Before recessions, heavy trucks sales tend to peak and then decline, providing insights into the overall health of the U.S. economy as a leading economic indicator. Click the Image to Enlarge

U.S. 10-Year Treasury Yield vs. Brent Oil Future

U.S. 10-Year Treasury Yield vs. Brent Oil Future Markets have treated oil and yields as a pair trade since the Middle East conflict began. Hopes of a peace deal could keep the oil-driven move in yields alive for now, but that relationship usually fades once the conflict is resolved. Image: Deutsche Bank

Semiconductors vs. Consensus Fwd 12m EPS

Semiconductors vs. Consensus Fwd 12m EPS Semiconductor stocks have rallied faster than analysts have raised near-term earnings estimates, leaving valuations stretched relative to short-term fundamentals. The easy upside appears largely exhausted. Image: Goldman Sachs Global Investment Research

S&P 500 – Corrections vs. Bear Markets

S&P 500 – Corrections vs. Bear Markets The S&P 500 now stands roughly 83% above its long-term trend, with the Shiller CAPE close to 42. Even a 20% selloff would fall short of signaling a regime shift. It would be a routine correction in a continuing bull market. Image: Real Investment Advice